8
Goal and Ecommerce Tracking
As first discussed in Chapter 2, “Google Analytics Reporting Overview,” Google Analytics (GA) does not populate the Conversions reports at all until you take either or both of the following steps:
- tell GA which existing pageview or event actions constitute a goal conversion
- provide additional Ecommerce data beyond pageview and event tracking
In either case, you’re enabling GA to measure success according to the specific key performance indicators (KPIs) that you identified for your website or mobile app as discussed in Chapter 3, “Measurement Strategy.”
It’s critical to configure goals and/or Ecommerce so your analytics can clearly tell you if your users are achieving these objectives.
Goal Tracking
In the following example, we set up a goal for a health tips email newsletter signup on a health insurance provider website—this is a primary action that the company executives and website designers want visitors to take, so we’re going to track it as a goal.
As we configure our goals, we need to consider four options:
- goal type
- match type (for Destination goals only)
- funnel or no funnel (for Destination goals only)
- goal value
We discuss each of these considerations in the next sections.
Configuring a Goal
Since goal configuration changes the underlying report data (by calculating conversion rate and related metrics) for everyone who accesses the corresponding GA view, you need Edit access to the view to set up a goal. We’ll discuss access rights in Chapter 9, “View Settings, View Filters, and Access Rights.”
Twenty Goals per View
GA allows us to create 20 goals per view. This limit should suffice for most websites or mobile apps, since we don’t want to track every user action as a goal, only those that indicate a central or supporting success relative to our KPIs.
If, however, you do need additional goal slots, you can always create a new view, apply the same view filters and settings, and set up more goals.
Goal Sets
As you create goals, GA by default populates the five goal slots in four goal sets in sequence. It’s perfectly acceptable to stick with the default sequencing, but you could opt to group related goals within a goal set, which would allow you, for example, to choose Goal Set 2 as the metric group in the Source/Medium report and display the conversion rate per Source/Medium for each goal within the goal set.
As just stated, however, it’s fine to stick with default goal sequencing. In most cases, you should analyze goals individually, so the initial grouping is not critical in most implementations.
Goal Type
Let’s start by clicking Goals in the view column on the admin screen, and then clicking New Goal. An initial screen displaying goal template options such as Place an Order or Media Play can be helpful to provide additional ideas for goal tracking, but select Custom and click Continue to access the goal setup screen shown in Figure 8.1.

Figure 8.1 As the first step of goal setup, specify the goal name and type. If you choose, you can also specify a goal slot other than the default.
Note that we have chosen Destination as the goal type. Destination is the most common goal type, since, in many cases, it’s a specific pageview or screen view that signifies the goal completion.
You can also create a goal based on any action that you have tracked as an event, such as a video play or a click on a specific offsite link. As another goal option that we will not be discussing, Smart Goals are designed to be used for AdWords when you don't have actual GA goals or Ecommerce in place.
Engagement Goals
Because they’re based on a threshold rather than a specific action, Duration and Pages/Screens per Session goals are referred to as engagement goals. Keep in mind that your Duration goals depend directly on hit timestamps. For example, if a visitor lands on a long blog page and spends 10 minutes scrolling and reading the blog post, but you haven’t set up any event or virtual pageview tracking for scrolling (as described in Chapter 6, “Events, Virtual Pageviews, Social Actions, and Errors”), that session will not count toward a 5-minute Duration goal.
The Pages/Screens per Session goal type, for its part, depends only on pageviews (physical or virtual) or screen views and does not consider time on page/screen or session duration.
Match Type
Because we chose Destination as the goal type in the previous step, we must now specify the text string for the matching page(s) or screen(s) as well as the match type. The page or screen text string that you specify is compared to the Page or Screen dimension values as listed in the Pages or Screens report. The match type defaults to Equals To, but you can change this to Begins With or Regular Expression, as shown in Figure 8.3, so more than one Page or Screen value would count as a conversion.

Figure 8.3 For a Destination goal, you can choose one of three match types.
Match Type Begins With
Let’s say that you manage a consumer credit website. The primary KPI for the website is the number of sessions in which a credit report is purchased. The user’s selection of delivery method for the credit report—by mail, or as PDF attachment in an email—determines the confirmation URL that the user is directed to /confirmation-mail or /confirmation-email. In this case, we could easily configure a Destination Goal with Begins With as the match type and /confirmation as the Page field, since these two confirmation pages should satisfy the same goal.
Match Type Regular Expression
Begins With would not be suitable, however, if there were other pages that began with /confirmation, such as /confirmation-contact-us but that should not count as a goal match, or if the two URLs for the credit report confirmation appeared as /mail-confirmation and /email-confirmation. In these cases, we’d need the specificity that only a regular expression could provide.
In the second case, we could select Regular Expression as the Match Type and specify the Page field as follows:
/(mail|email)-confirmationThe regular expression above uses the pipe metacharacter to signify or. At the beginning of the regular expression, we “escaped” the forward slash with a backslash to ensure that the forward slash is interpreted as a literal character.
Too much duplication between mail and email in the regular expression? We could rewrite the regular expression more efficiently using the ? quantifier metacharacter to signify zero or one occurrences of the preceding character:
/e?mail-confirmationChapter 9 includes an overview of regular expressions.
Goal Value
Though not obligatory, Goal Value is very useful—especially if you do not have Ecommerce tracking enabled—since it allows GA to calculate metrics such as Page Value, which we discuss later in the chapter, and Per-Session Goal Value.
Goal values are not dynamic; the static value that you configure is used in each goal completion. (Goals based on events can pull in varying event values as the goal value, but event value is not normally specified as part of event tracking.) For purchases of products and services at varying price points, Ecommerce tracking, discussed later in this chapter, offers greater flexibility than goal tracking.
There is not necessarily a single correct approach, but some recommendations follow.
- Single goal, actual value. If you’re configuring a goal to track the sale of only one product or service, populate the purchase price as the goal value.
- Single goal, estimated value. If you’re configuring a goal to track a lead submission for £1,000 financial consulting engagement, and you close 10% of leads, populate £100 as the goal value.
- Single goal, nonmonetized. If you’re tracking a goal that’s not in any way monetized, populate an arbitrary value: €1 or €100 or €1,000 (as in Figure 8.4). The relative Page Value and Per Session Goal Value metrics will still be fully valid for comparison purposes.
- Multiple goals, actual or estimated values. Set up the goals and populate individually with the actual or estimated values. You can also opt to duplicate any goal in a separate view to report on Page Value and Per-Session Goal Value based on Goal Value only for a single goal only.
- Multiple goals, nonmonetized. Set proportional goal values for each goal. If, for instance, you consider your Contact Us goal to be twice as important as your Mailing List Signup goal, you can assign respective Goal Values of $2 and $1. You can also duplicate the goals in separate views, again, for separate Page Value or Per-Session Goal Value metrics by goal.
- Ecommerce and goals. This is probably the trickiest scenario. If you’re tracking Ecommerce and goals in the same main view, you may want to consider duplicating your goal in a separate view and specifying Goal Value for that goal in that separate view. This will allow GA to calculate Page Value separately for Ecommerce transactions (in the main view) and for goal completions (in the separate view). There’s no need to refer to the separate view, however, for Ecommerce- and goal-specific metrics, such as Revenue and Per-Session Value for Ecommerce and Per-Session Goal Value for goal completions; GA will calculate these separately in the main view.

Figure 8.4 Goal value is optional but usually recommended. Even in the case of nonmonetized goals, populating an arbitrary goal value such as US$1 or €100 will allow GA to calculate Page Value and Per Session Goal Value.
Goal Funnel
Going back to the health tips newsletter signup, our Web designers envisioned the conversion process to consist of three pages:
- health tips page, with a link to the newsletter signup form
- newsletter signup form page, with delivery and subject selections
- signup confirmation page
We have already set the final step in the funnel as the Destination field in the previous example: the bottom of the funnel appears at the top of the goal configuration. We now need to just specify the first two funnel steps as in Figure 8.5.

Figure 8.5 Funnel configuration is possible for Destination goals only. Though a funnel is not required, it is recommended wherever designated steps precede the goal completion.
Note that, by default, the Funnel Visualization Report will display entries at any funnel step, not just the first. If you want to restrict the funnel to top-step entries only, you can set the Required? toggle for the first step to Yes. You could also create two goals with identical funnel steps but different first-step Required settings. (Instead of manually re-creating the goal, you can use the Share Asset feature to share the goal with yourself as previously mentioned and then just change the first-step Required setting in the new copy.) This would provide two different ways to view entries and completions in the same funnel for the same goal.
Funnel Is Recommended but Not Required
A funnel is not required to calculate Goal Conversion Rate. It is, however, required for the following reporting elements, so it is therefore recommended:
- Funnel Visualization report.
- Funnel Conversion Rate (appears at the bottom of the Funnel Visualization report).
- Goal Abandonment Rate (appears in the Goal Overview report).
While a funnel is recommended, and is required to populate the Funnel Visualization report and also to calculate the Goal Abandonment Rate and the Funnel Conversion Rate (which will be shown in Figure 8.9), it’s not required to calculate the Goal Conversion Rate.

Figure 8.6 Metrics in the Goal Overview report.
A goal funnel is not required to populate the Goal Flow report (Figure 8.10) for a given goal, but it makes the report more useful.
If you’re unsure of your funnel steps, omit them at first, and proceed with your goal setup. Once the goal has been running for a period of time, you can view the Reverse Goal Path report (which will be shown in Figure 8.11) to understand the actual paths that visitors are taking to your goal completion pages or screens, and you can then map the most common path(s) as funnel steps in the original goal or in a new goal and thereby measure drop-off between the steps leading to conversion.
Goal and Funnel Reports
Once you have configured a goal, GA will start calculating goal-related metrics and populating the Goal Reports. We will discuss the goal reports as well as goal metrics that appear within other reports.
Goal Overview
It’s usually advisable to analyze goals individually, so if you have multiple goals configured in the view, select a single goal for display as in Figure 8.6.
Conversion Rate: Perhaps Not What You Think
In the context of goals, a conversion is a completion. Although the two terms are used in different metrics, they represent the same concept. Let’s continue by clarifying two potentially confusing points about goal conversions and conversion rate:
- For a given goal, a single user cannot convert more than once during a session. If you have two newsletter signups that lead to the same thank-you page, GA will record only one conversion for a session in which a user signs up for both newsletters. Conversely, one user can convert multiple times on the same goal, but only in separate sessions.
- Goals metrics are based on sessions, not users. Because conversion rates are based on sessions and not users, they can sometimes appear bleaker than they are in reality. If you see a 1% conversion rate for application submission on a mortgage website that you’re analyzing, it does not mean that 1% of people are converting; it means that 1% of sessions included a conversion.
Especially for costly or complex propositions, it may take several return sessions for a user to convert, as we’ll be able to see in the Multi-Channel Funnel reports discussed later. If you’re presenting your conversion data at a company meeting and someone asks why only 1% of people are converting, that’s your cue to briefly explain the concept of a session and clarify the definition of conversion rate, as shown in Figure 8.7.

Figure 8.7 Since conversion rate is defined as conversions per session, it appears lower in all instances than if defined as conversions per user.
Why doesn’t GA base conversion rate on users rather than sessions? While this would be useful, unique users as a metric is much more difficult to determine than sessions (because of multiple-device usage, cookie deletion, etc.), so conversion rate based on users would suffer a much greater margin of error. That said, we can, if we choose, create our own calculated metric for user-based conversion rate, as described in Chapter 12.
Abandonment Rate
In Figure 8.6 (previously shown), why isn’t abandonment rate the inverse of conversion rate? While goal conversion rate is based on all sessions and is not influenced by a funnel, goal abandonment rate is based only on the number of sessions in which the funnel was entered (but the goal was not completed). If you do not configure a funnel for a goal, GA will not calculate an abandonment rate for that goal.
Funnel Visualization
GA offers two reports for goal funnels: Funnel Visualization and Goal Flow. These reports are very useful, but, as described below, some aspects of these reports are not readily apparent, particularly for Funnel Visualization.
Note that the Custom Funnel feature available in Analytics 360 and discussed in Chapter 18, “Analytics 360,” is somewhat similar to goal funnels but is not necessarily related to goal completions and also, importantly, applies retroactively. Furthermore, the backfilling issue described in the sections below does not affect Custom Funnels, and you can also configure a Custom Funnel to include funnel completions during a single session or over multiple sessions.
Funnel Conversion Rate Is Based on Funnel Completions—Goal Conversion Rate Is Not
It may be surprising that GA calculates goal conversion rate without considering any funnel that you may have configured. If you have created two goals with the same destination page but funnels containing different steps, the abandonment rates for the two goals will certainly differ, but the conversion rates would be identical.
Funnel Step Completions Correspond to Unique Pageviews
As we discussed in Chapter 2, the Unique Pageviews metric represents the number of sessions in which a page was viewed at least one time. Funnel step counts are based on Unique Pageviews: if a user views a funnel page 1 time or 10 times before conversion during a session, the count for the funnel step will increase by one only.
Funnel Steps Don’t Need to Be Completed Sequentially
Funnel steps don’t need to be completed sequentially to count. If a user views other pages in between funnel steps, the step counts in the Funnel Visualization are still incremented normally. In fact, the funnel steps don’t even need to be completed in the order you specified: if a user happens to view your third funnel step before your first funnel step, both steps are still incremented normally.
This might lead you to ask: what if step 3 actually does experience more pageviews than step 2? In this case, something strange and somewhat inexplicable called backfilling occurs in the Funnel Visualization report: step 2 will appear with a marginally higher unique pageview count than step 3 (minus the entries directly at step 3 if you have not made the first step required).
The good news is that backfilling does not occur in most funnels. The two following scenarios are the most susceptible to backfilling:
- an optional step that many users skip in a process
- a more specific page (such as an article category page) that leads to a more general page (such as newsletter signup page for all article categories)
How can you tell if your funnel is a victim of backfilling? You can check your funnel step counts against the Unique Pageview counts in the All Pages report: if a funnel step count is greatly inflated relative to Unique Pageviews in the All Pages report, backfilling is occurring in the Funnel Visualization report. Even quicker: check the Goal Flow report, described later, which is not subject to backfilling.
You Can’t Apply Segments to Funnel Visualizations
Unlike most other GA reports, Funnel Visualization does not allow you to apply the segments discussed in Chapter 10, so you cannot therefore dynamically segment your funnel for visits from Chile and Argentina or organic clickthroughs from Bing, just as two examples.
Since you can apply segments to Goal Flow shown in Figure 8.10, you can refer to this report instead of the Funnel Visualization if you do need to segment. If, however, it is important for you to display the drop-off percentages of the Funnel Visualization report itself for a specific traffic segment such as those mentioned above, you can create a dedicated, hard-filtered view as described in Chapter 9, thereby ensuring that every report in the view, including Funnel Visualization, reflects only the subset of sessions after filtering.

Figure 8.10 Goal Flow report offers some advantages over Funnel Visualization but may require more interpretation.
Goal Flow
While the Goal Flow report populates for goals that don’t have funnels configured, it’s more useful for goals that do have funnels and serves as a good complement to the Funnel Visualization report in the following ways:
- Segments: unlike the Funnel Visualization report, you can apply segments to Goal Flow.
- No backfill: the backfill issue does not affect Goal Flow. (The First Step Required setting in the funnel setup also does not apply to Goal Flow.)
- Level of detail: you can apply a more aggregated or more granular level of detail to Goal Flow, which can help to illustrate skipping of funnel steps and even looping back to previous funnel steps.
With these advantages of Goal Flow over Funnel Visualization, what’s the downside? The Goal Flow overall requires more interaction and interpretation, as shown in Figure 8.10. It’s worthwhile for your own analysis but may be somewhat less suitable than the Funnel Visualization for a general audience.
Reverse Goal Path
The Reverse Goal Path report (Figure 8.11) shows the most frequent series of three pageviews or screen views that lead to a goal. You might wonder: if I have this report, why do I need the Funnel Visualization (or Goal Flow)? Notice that the Reverse Goal Path indicates only the most popular paths but does not show page-to-page drop-off (and also that it goes back three pages only). The Reverse Goal Path provides the best ideas for funnels if you have previously defined goals without them: set up a funnel for the most popular paths as reported view drop-off in the Funnel Visualization and Goal Flow reports, and begin to optimize for goal completions.

Figure 8.11 Reverse Goal Path report shows how visitors are actually getting to your goal pages.
Ecommerce Tracking
Goal tracking, while extremely useful, is not ideally suited for Ecommerce transactions that entail different products, quantities, and price points. To record the detail for these more varied types of transactions, Ecommerce tracking offers the needed flexibility.
We’ll consider two types of Ecommerce tracking: basic Ecommerce, and Enhanced Ecommerce. As you might expect, Enhanced Ecommerce requires more setup than basic Ecommerce, but they both differ from goal tracking in this fundamental way: you configure goals within the view admin screen and based on hits that are already captured as pageviews or events, while both types of Ecommerce tracking normally require you to work with your developers to push additional data into GA specifically about the Ecommerce transaction.
As a note, while Google Tag Manager (GTM) facilitates event tracking that might otherwise require code-level changes, GTM normally cannot help to automate Ecommerce tracking or avoid all code-level changes, since, in most implementations, you still need to populate Ecommerce-specific variables from the back end into the data layer as discussed below.
Configuring Basic Ecommerce Tracking
Setup for basic Ecommerce requires three steps:
- Work with your developers to populate the data layer with Ecommerce transaction and product variables, normally on the purchase confirmation page.
- In GTM, create a GA transaction tag and a corresponding trigger.
- Enable Ecommerce Tracking in one or more views.
Each of these steps is detailed below.
Populate the Data Layer with Ecommerce Variables
This step represents most of the work in Ecommerce configuration. You’ll need to work with your developers to populate your transaction confirmation page with specific back-end data for the transaction and one or more specific products.
You can use five variables for the transaction data:
- transactionId (required)
- transactionTotal (required)
- transactionProducts (optional, but used routinely)
- transactionShipping (optional)
- transactionTax (optional)
As noted above, transactionProducts is optional but is usually populated. Unlike the other transaction variables, which require a single value, transactionProducts requires one or more product objects that can take the following variables:
- name (required)
- sku (required)
- price (required)
- quantity (required)
- category (optional)
You could populate the data layer as in Listing 8.1. Note that the listing displays the output of server-side coding; you can work with your developers to actually pull the Ecommerce values from the back end and format as demonstrated.
Create a Transaction Tag in GTM
In Chapter 4, “Account Creation and Tracking Code Installation,” we discussed the concept of a hit as basically a packet of dimension values sent to GA. The primary hit types that we have examined thus far are pageviews and events, and we also discussed social hits in Chapter 6. We now get to work with another kind of GA hit: Ecommerce transaction.
To generate a transaction hit through GTM:
- Create a GA tag.
- Set the Tracking ID to the same value that we’re using for pageviews and events (ideally by using the GA Tracking ID variable that we first created in Figure 5.5).
- Set the Track Type to Transaction as shown in Figure 8.15.

Figure 8.15 A GA tag with Track Type set to Transaction automatically reads Ecommerce variables that you have populated into the data layer.
You do not need to create GTM Data Layer variables: a GA tag with Track Type set to Transaction will automatically read in the Ecommerce variables named in the data layer as indicated above.
Populate the Data Layer Before the Transaction Tag Fires
To make sure that the Ecommerce variables are populated into the data layer as shown in Listing 8.1 when the GA Transaction tag fires, we can take either of the two following options:
- Populate the data layer with Ecommerce variables before the GTM container code occurs in the page; in this case, you could apply a basic Page View trigger to the Transaction tag, for example, {{Page Path}} equals /receipt
- Apply a DOM Ready trigger (first discussed in Chapter 5) to the GA Transaction tag so the page has been fully parsed when the tag looks for the Ecommerce variables in the data layer; an example trigger would be Page View – DOM Ready – {{Page Path}} equals /receipt
Reusing Existing Ecommerce Variables
If the variables that you need for GA Ecommerce tracking are already present on the page as different variable names, or if your environment blocks the dataLayer object, you can instead use an Enhanced Ecommerce purchase action with a Custom JavaScript variable (instead of using a GA Transaction tag). See Reading Enhanced Ecommerce Data from Your Own Object Variable below.
Enable Ecommerce Setting
As the final (and certainly the easiest) step for Ecommerce configuration, turn on the Enable Ecommerce toggle in the Ecommerce Settings for one or more views within the property for which you have performed the two previous steps.
Ecommerce Reporting
The variables listed above that you populate in Ecommerce tracking become available as dimensions and metrics within the several built-in Ecommerce reports that GA provides. Some of the metrics in the Ecommerce Overview report shown in Figure 8.16 require explanation.

Figure 8.16 Metrics in the Ecommerce Overview report.
If you went to a hiking website that had GA Ecommerce enabled and you purchased one pair of hiking boots and two pairs of the same hiking socks, Transactions would increment by one, Unique Purchases would increment by two (two products included at least one time in the transaction), and Quantity would increment by three (three product units total in the transaction).
Similarly to goal conversions, a visitor can convert for Ecommerce one time only in a given session, meaning that Ecommerce Conversion Rate only considers if there is at least one Ecommerce transaction in the session. Additional transactions in the same session would not increase Ecommerce Conversion Rate but would increase other Ecommerce metrics (such as Revenue). In this way, GA recognizes a conversion for a given goal or for Ecommerce once per session only, but it will record multiple Ecommerce transactions.
Transactions with the same Transaction ID within the same session, however, are not double counted; to record additional transactions within a session, you must make sure to use different Transaction IDs.
In the Product Performance report, you can switch the primary dimension to view metrics by Product, Product SKU, or (if populated) Product Category. The Sales Performance and Transactions reports break down the metrics by date and transaction ID, respectively.
The Ecommerce Time to Purchase report shows the time lapse between the last nondirect session and the purchase. For further lookback, see the Time Lag report shown later in Figure 8.17.

Figure 8.17 The Shopping Behavior report shows progress and drop-off from site entry through transaction.
Enhanced Ecommerce
While basic Ecommerce tracking provides much greater detail than goal tracking, it only measures the transaction itself. It still doesn’t track the several steps that usually must precede an Ecommerce transaction: essentially, the Ecommerce funnel.
You can implement GA Enhanced Ecommerce tracking to populate a range of additional Ecommerce reports and metrics in GA; let’s review the reports and metrics before examining the corresponding code requirements.
- Shopping Behavior: displays a five-stage funnel from session start to purchase (Figure 8.17).
- Checkout Behavior: displays up to eight funnel steps corresponding to the checkout process (Figure 8.18).
- Product Performance: to this report, Enhanced Ecommerce adds the Cart-to-Detail Rate and the Buy-to-Detail Rate as performance metrics after visitors have viewed a product details page (Figure 8.19).
- Product List Performance: shows performance from impression through revenue by product, product list, and product list position (Figure 8.20).
- Internal Promotion: shows clicks and views for internal promotions (such as a banner) and performance metrics following the click (Figure 8.21).
- Order Coupon, Product Coupon: transactions by order-based coupons (e.g., 20% off your order) and product-based coupons (e.g., 20% off a specific item) submitted during checkout.
- Affiliate Code: revenue, transactions, and average order value for clickthroughs from affiliate programs.

Figure 8.18 You can configure the Checkout Behavior report to display the specific steps within checkout.
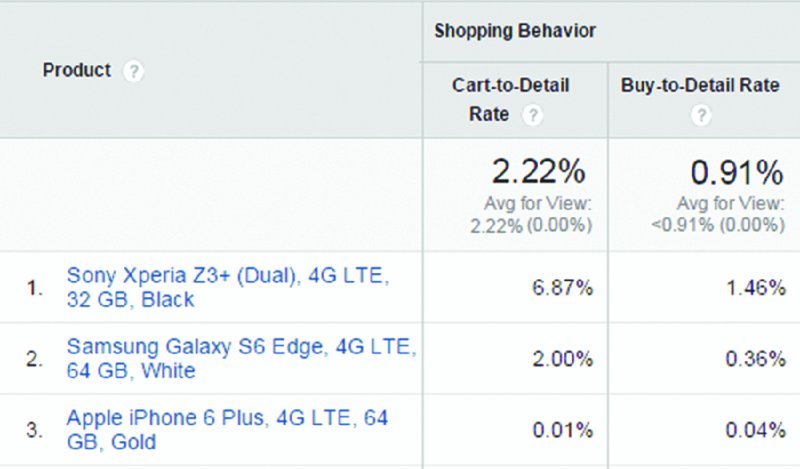
Figure 8.19 With Enhanced Ecommerce implemented, the Product Performance report lists the Cart-to-Detail and Buy-to-Detail.

Figure 8.20 Product List report displays performance in terms of views, clicks, purchases and other metrics, broken down by the list parameters that you provide in the Enhanced Ecommerce code.

Figure 8.21 Internal Promotion Report shows click and purchase metrics for internal promotional banners and text links.
Implementing Enhanced Ecommerce Tracking
Enhanced Ecommerce implementation is similar to basic Ecommerce in that you typically populate the data layer with back-end data that a GA tag in GTM will read in and record. If you currently track basic Ecommerce, you’ll be able to migrate to Enhanced Ecommerce without losing the Ecommerce data that you’ve already captured.
As we’ll soon see, somewhat surprisingly, you don’t implement Enhanced Ecommerce using a GA tag with Track Type set to Transaction. Instead, the Enhanced Ecommerce variables are read from the data layer by a Page View or Event tag that you have enabled for Enhanced Ecommerce.
As we saw in the preceding section, basic Ecommerce implementation is more difficult than goal configuration since it normally requires your developers to populate the GTM data layer with additional data from the back end. Enhanced Ecommerce, for its part, is significantly more complex than basic Ecommerce and is undoubtedly the most challenging code-level aspect of GA implementation.
To make this topic more approachable, we review a high-level outline as well as specific code examples. For reference, we’ll be using the very helpful and interactive Google Analytics “Enhanced Ecommerce” demo at https://ga-dev-tools.appspot.com/enhanced-ecommerce/. please be sure to access this demo directly as we proceed through the examples.
Also refer to the Google Tag Manager “Enhanced Ecommerce (UA) Developer Guide ” at https://developers.google.com/tag-manager/enhanced-ecommerce for additional detail on the Enhanced Ecommerce data objects.
What Data Do You Track for Enhanced Ecommerce?
From an implementation standpoint, we can consider Enhanced Ecommerce as tracking four types of occurrences:
- Product Impressions: the user was exposed to a product listing without accessing information about that product specifically. (If the user does click through to a product page, you’d capture product click and product detail actions separately from the impression, as discussed below.) You often record several product impressions (for all products on a page or screen) as an array at one time.
- Product Actions: for the many types of actions that the user can perform on a product or an array of products, you specify the following elements:
- Action—specific action that the user takes or experiences. Actions include:
- Click
- Detail
- Add (to cart)
- Remove (from cart)
- Checkout
- Checkout_option (discussed below)
- Purchase
- Refund
- ActionField—additional data that you can embed in some types of actions, such as checkout step for a checkout action or tax and shipping for a purchase action.
- Products—the one or more products that the action applies to. For instance, you’d normally apply an add (to cart) action to a single product only but a checkout action to an array of all products in the shopping cart.
- CurrencyCode—optional field to designate a currency from which the Ecommerce needs to be converted to match the currency setting in your GA view; especially useful if you process transactions in multiple currencies.
- Action—specific action that the user takes or experiences. Actions include:
- Promotion Impressions: you can capture promotion impressions to which the user was exposed.
- Promotion Clicks: you can also capture clickthroughs on a promotion impression.
The sections below detail the tracking for these occurrences. Keep in mind that you are not required to implement all aspects of Enhanced Ecommerce at one time. You could start, for example, by tracking only product detail pageviews, adds to cart, and purchases, and later add impressions, promotions, and checkout steps. That said, it’s advisable right from the start, while you’re making the effort, to + implement tracking that will provide an actionable level of data for your Ecommerce analysis.
Pageview or Event Tag for Enhanced Ecommerce
As demonstrated in Figure 8.15, we set the Track Type in the GA tag for basic Ecommerce tracking to Transaction; for basic Ecommerce, it’s the Transaction tag that reads the Ecommerce data from the data layer and sends it to GA. As mentioned previously, however, you use a GA tag with Track Type set to either Page View (or App View in mobile app tracking) or Event to pass Enhanced Ecommerce data.
So which do you choose, pageview or event? In most cases, that depends on whether the user executed a specific step or if the user was just exposed to the product or promotion as part of the page (or screen) load.
Occurrences to Track with a Pageview Tag
You’d normally track product impressions and promotion impressions in a pageview tag. You’d also normally track a product detail action in a pageview tag. You can also use a pageview tag for product add to cart, remove from cart, checkout, and purchase if these occur on separate pages.
Figure 8.22 shows a Page View tag enabled to read Enhanced Ecommerce variables from the data layer.

Figure 8.22 You can enable a Page View tag, as shown in this figure, or an Event tag to read Enhanced Ecommerce variables from the data layer.
Occurrences to Track with an Event Tag
If any of the actions mentioned previously occur on the original page without a new page load—common in AJAX-based checkout scenarios as demonstrated in Figure 6.26—you can track them instead with events.
You can also use an event tag instead of a pageview tag for product or promotion impressions that are not initially rendered on the page but are instead generated through additional user interaction—typically scrolling.
You’d normally track product actions that don’t coincide with a pageview, and also promotion clicks, in an event tag.
Product and Promotion Impressions
As you use the Google Analytics Ecommerce demo, you can click the icons to view the code that executes on pageview or click and populates the data layer with Enhanced Ecommerce variables, as illustrated in Figure 8.2.
In Listing 8.2, we see that multiple product impressions (just two shown in the listing for brevity) and also the Back to School promo impression are pushed to the data layer. Since these impressions occur as soon as the page loads, and without further interaction on the part of the user, you can enable the GA pageview tag in GTM to read in this Enhanced Ecommerce data from the data layer. You should place the code in Listing 8.2 before the GTM container code (or set the pageview tag to fire on DOM ready instead of the default page load).

Figure 8.23 You can enable a Page View tag, as shown in this figure, or an Event tag to read Enhanced Ecommerce variables from the data layer.
Product Click
Listing 8.3 shows the code that is executed when a shirt is clicked. Note that it populates an optional list field.
Also note that the event field in the second line of the listing corresponds to a Custom Event trigger that you can apply to any tag, as first demonstrated in Figure 6.16. In this example, there would be a Custom Event trigger listening for"event":"productClick" in the data layer, at which point it would fire a GA event tag to which that trigger was applied that was enabled to read Enhanced Ecommerce data from the data layer.
Instead of setting up a new tag and trigger in GTM for each type of click action as in the online demo, we could reuse the “catch-all” event tag, data layer variables, and trigger that we implemented as demonstrated in Figures 6.32, 6.33, and 6.34. To take advantage of this existing infrastructure, replace"event":"productClick", with:
"event":"eventTracker","eventCat":"ecommerce","eventAct":"click","eventLbl":"product",Note that the specific event category, action, and label values aren’t that critical in themselves; we’re just using the event tag to convey the Enhanced Ecommerce data, which will be the focus of our analysis rather than the event data.
Promotion Click
If we click the small icon for the Back to School banner, we see the code in Listing 8.4. As in Listing 8.3, we can replace"event":"promotionClick" with four data layer variables that our existing catch-all event tag will use.
Note that the Enhanced Ecommerce promotion impressions and promotion clicks provide a safe way to track internal campaigns. In Chapter 7, we warned against campaign parameters for internal campaigns because they spawn a new session and break the attribution of subsequent actions to the rightful traffic source, so make sure to squelch any temptation to use campaign parameters in parallel with Enhanced Ecommerce promotions.
Product Detail
When the product detail page pictured in Figure 8.24 loads, the GA pageview tag will read the product detail, product impression (for the shirts listed on the bottom), and promotion impression data that we wrote to the data layer.

Figure 8.24 Product detail, product impression, and promotion impression data is recorded when this product description page loads.
Product click and product detail may seem redundant, since one should lead to the other, but product click actions are used specifically to calculate the Product List Clicks metric that appears in the Product List report.
Add and Remove (To and From Cart)
The code that is populating the add-to-cart action for the main shirt on the page appears in Listing 8.5. Note that the code for the remove action is identical, except add is replaced with remove. There is no reference maintained for the product that was previously added to the cart, so we must again specify all the product fields.
Also note that"event":"addToCart" and"event":"removeFromCart" differ in the online demo, but, again, the event variable in the data layer is just used to trigger a GTM tag, and we could instead push the four values used in our event catch-all tag, as in previous examples.
Checkout Steps
We need to discuss checkout action somewhat separately from the other Enhanced Ecommerce actions because we’re going to configure and populate multiple checkout steps that will appear in the Checkout Behavior funnel.
Let’s first complete the required admin configuration. (As a note, even if we are not populating the Checkout Behavior funnel, we need to enable the Enhanced Ecommerce toggle as shown in Figure 8.25.)

Figure 8.25 The Checkout Behavior steps appear as you have named them in the Enhanced Ecommerce Settings.
If we do want to populate the Checkout Behavior funnel, we must begin by adding the steps: note the correspondence with the names of the checkout steps in Figure 8.18. For the Ecommerce Demo, we would instead name steps that correspond to each of the tabs that represent different checkout steps. In this way, we can configure Checkout Behavior report to match our checkout steps as they occur in our own checkout process.
With our checkout steps set up, we can begin receiving checkout data, as shown in Listing 8.6 for the Shipping tab of the online demo. Note that for each of our checkout steps and our purchase action, we’d include all products in the cart. (We have only one product in the cart for our example.)
Checkout Options
You can record additional user input in the checkout process, such as the credit card selection that appears in Figure 8.26. As indicated in Listing 8.7, we don’t need to include product information with a checkout_option action; we just need to associate it with a checkout action for which you have specified the same step number: step 3, in the example.

Figure 8.26 You can capture selections in the checkout process such as credit card as Enhanced Ecommerce checkout options.
Because the checkout_option check step corresponds to a checkout step that you’ve already recorded, you typically record a check_option in a separate GA event or potentially at the time that the following checkout step is recorded. (In this way, you’d record checkout_option for step 2 at the same time as checkout step 3.)
Purchase
The purchase action is similar to the checkout action in that you apply it to all products that are in the cart. You use the actionField to specify additional detail about the purchase.
Coupon
When recording a purchase, you have the option of applying a coupon value at the transaction or product level, both shown in Listing 8.8.
As a related note mentioned in Chapter 6, you can rename the two instances of dataLayer in the GTM container code if this variable name is already in use for another purpose. If, for example, you changed the name in the container snippet to gtmDataLayer, you’d use that variable name to populate the GTM data layer for Enhanced Ecommerce and so forth.
Enhanced Ecommerce in Testing and Live Environments
In Chapter 5, we learned about the Environments feature in GTM that allows you to publish a single container into development, staging, and live environments.
Because Enhanced Ecommerce (as well as basic Ecommerce) relies both on code-level changes within the page and on tag changes within the container, you’ll need to coordinate your development-to-testing and especially your testing-to-live updates so you’re pushing code at the same time as you’re publishing to the Live environment in GTM.
As detailed in the Chapter 5 discussion, you can use a GTM Custom JavaScript or Lookup Table variable to dynamically track your Enhanced Ecommerce transactions to a dedicated development and/or test GA property from a development/test hostname (e.g., test.mysite.com) and to your main/live GA property from your live hostname.
Ecommerce and Enhanced Ecommerce Tracking in Mobile Apps
As, we’ll learn in Chapter 13, the two basic GA tracking options for mobile apps are the GA SDK or the GTM SDK (either for iOS or Android in both cases). If you’re using a GTM SDK, the process is similar to Ecommerce or Enhanced Ecommerce tracking for a website as detailed above.
For basic Ecommerce tracking through GTM:
- Use a GA tag with Track Type set to Transaction.
- Populate the data layer with the designated Ecommerce variables.
For Enhanced Ecommerce tracking through GTM:
- Use one or more tags with Track Type set to App View (meaning screen view) or Event.
- Select the Enable Enhanced Ecommerce Features setting and Use Data Layer settings, as shown previously in Figure 8.22.
- Populate the data layer with the designated Ecommerce variables.
For code examples, see:
- Google Tag Manager for Android—Enhanced Ecommerce (https://developers.google.com/tag-manager/android/v4/enhanced-ecommerce)
-
Google Tag Manager for iOS—Enhanced Ecommerce (https://developers.google.com/tag-manager/ios/v3/enhanced-ecommerce)
For Ecommerce and Enhanced Ecommerce tracking through the GA SDKs, see:
- Enhanced Ecommerce Tracking—Android SDKv4 (https://developers.google.com/analytics/devguides/collection/android/v4/enhanced-ecommerce)
- Enhanced Ecommerce Tracking—iOS SDK (https://developers.google.com/analytics/devguides/collection/ios/v3/enhanced-ecommerce)
This documentation is current at the time of writing; you can check for any updates. You can use the demonstrated syntax to write to the data layer for basic or Enhanced Ecommerce tracking.
If you’re using the third-party cart for in-app purchases, ask your provider the questions listed in Integrating with “Third-Party Shopping Carts” below.
Segmenting and Remarketing Based on Shopping and Checkout Behavior Funnels
In Chapter 10, “Segments,” we’ll see how segments can narrow the audience we’re analyzing to highlight significant points in the data. As a preview, let’s consider segmentation scenarios for the Shopping Behavior and Checkout Behavior funnels:
- Create a segment based on abandonment (or continuation) at a funnel step. We can create a segment from any point in either of the funnel and then apply it to other reports. In Figure 8.35, we’re creating a segment for all shopping cart abandoners. We could also create a counterpart segment: visitors who continued to checkout. If we applied both of these segments to the Mobile Devices report, for example, we could see which devices experience the most abandonments.
- Create a segment based on other report data and apply to the Enhanced Ecommerce reports. As a complementary approach, we would create a segment based on a mobile device (Android tablets, for example) and apply this segment to the Shopping or Checkout Behavior funnels, or any of the other Enhanced Ecommerce reports.

Figure 8.35 You can easily create custom segments or remarketing audiences from any continuation or abandonment point in the Shopping Analysis or Checkout Analysis funnels.
As we learn in Chapter 14, GA remarketing audiences for AdWords are defined essentially the same way as segments, and dynamic remarketing will allow us to display specific product details in our remarketing ads.
Multi-Channel Funnel Reports
Goal and Ecommerce metrics also appear outside of the conversion reports, as in the Source/Medium report shown in Figure 8.36. The conversion data in this report seems quite straightforward, and we might be tempted to say that Google organic traffic drove 4,766 lead submissions.

Figure 8.36 last-click attribution, goal and Ecommerce data in the Source/Medium report does not apportion credit among multiple channels for the conversions.
Before feeling confident in this observation, however, we need to recognize that some or many of these 4,766 conversions should be attributed, at least in part, to other traffic sources.
Last-Click Attribution
Most of the GA reports display conversion data according to last-click attribution: the source that drove the converting visit receives credit—all credit—for the conversion, even if one or more previous sessions were driven by a different channel. (The exception is a returning direct visit, which pulls in the more specific previous source and medium values, as demonstrated in Figures 7.22 and 7.23.)
As an example, for the 4,766 lead submissions attributed to Google/organic, many of the converting sessions could have been preceded by a clickthrough from a paid campaign or an email. When we remember from Chapter 7 that much of the traffic reported as organic in GA is branded organic, and therefore not truly organic but navigational and very similar in essence to direct traffic, it’s even more of an inaccuracy to give Google/ organic full credit for the 4,766 lead submissions.
Multi-Channel Funnel Reports
As discussed below, the Multi-Channel Funnel (MCF) reports provide a more complete picture of your visitors’ journeys to conversion. In fact, you should devote a large part of your conversion analysis to the MCF reports, especially if you are responsible for driving traffic to a website.
Assisted Conversions
The Assisted Conversions report shown in Figure 8.37 is indispensable for demonstrating the traffic sources that drove initial and assisting sessions for visitors who ultimately converted in a returning session, in many cases from another traffic source.

Figure 8.37 The Assisted Conversions report indicates how often a channel provided a conversion assist prior to a converting return session. A value greater than 1 for Assisted/Last Click or Direct Conversions indicates that the channel is stronger for assists than for the converting sessions.
As shown in Figure 8.38, the top portion of the MCF reports provide many configurable options:
- Conversion: MCF reports default to all goals and Ecommerce transactions, but you can narrow focus to a smaller conversion selection.
- All/AdWords: You can display the MCF reports for AdWords (so that the Assisted Conversion report, for example, defaults to AdWords campaign as the primary dimension).
- Lookback Window: the default is a 30-day lookback, but it can be useful to extend the lookback to the maximum 90 days for a more complete attribution story. (If one of your visitors converts on an organic clickthrough today, wouldn’t you want to know if that visitor clicked through from your email campaign 89 days ago but did not convert at that time?)
- First Interaction Analysis: the MCF reports default to Assisting Conversion Analysis, but you can change the display to First Interaction Analysis. (First Click Conversions are a subset of Assisted Conversions, not separate from Assisted Conversions.)
- Conversion Segments: you cannot apply the same segments to the MCF reports that you can to other GA reports. You can, however, apply built-in and custom Conversion segments, such as Last Interaction Is Organic Search. (As stated earlier for Funnel Visualization, if you need to view the MCF reports for a specific portion of your traffic, such as a country or a source, you can set up a dedicated filtered view, as described in Chapter 9.)

Figure 8.38 You can configure several options at the top of the MCF reports.
Top Conversion Paths
The Top Conversion Paths report does not relate to the pages viewed before a conversion; path in this context refers to the channels that drove the sessions leading to and including conversion as shown in Figure 8.39. Note that in the Top Conversion Paths report as well as the other MCF reports, Direct has the same precedence as the other channels; it is not overwritten by a more specific channel from a previous session as in the Acquisition reports.

Figure 8.39 These two rows from the Top Conversion Path report show, respectively, that 569 conversions occurred on an organic search clickthrough preceded by a paid search clickthrough and that 565 conversions occurred during a direct session preceded by two email clickthroughs.
You can display the Top Conversion Paths report with other primary dimensions selected, such as Source/Medium, as illustrated in Figure 8.40, or Campaign.

Figure 8.40 You can set the primary dimension in the MCF reports to Source/Medium, as above, or to Campaign.
Time Lag
The Time Lag report, shown in Figure 8.41, indicates how long it takes for the conversions to occur relative to the first session.

Figure 8.41 This portion of the Time Lag report indicates that 35.64% (the inverse of 64.36%) of conversions occurred more than one day after the initial session.
Note that the Multi-Channel Funnel reports don’t exist in GA mobile app views, but if you have Ecommerce or Enhanced Ecommerce tracking configured for a mobile app, the Ecommerce ˃ Time to Purchase report can provide similar data to Time Lag (but for Ecommerce transactions only, not for goal completions).
Path Length
As in Top Conversion Paths shown above, the path in the Path Length report, shown in Figure 8.42, refers to the channels that drove one or more sessions that (eventually) led to a conversion.

Figure 8.42 This portion of the Path Length report indicates a nearly even split between conversions that occur on the first visit and conversions that required two or more sessions.
Attribution Model Comparison Tool
Attribution modeling is the art/science/practice of experimenting with different ways to assign conversion credit to marketing channels based on factors including position in the conversion path, attributes of user interactions, and engagement metrics to better show the value of marketing investments across the conversion funnel.
You can use the model comparison tool to compare channel performance according to different built-in (or custom) models. In Figure 8.43, we’re comparing the number of conversions that would be attributed to each channel according to different attribution models:
- Last Interaction: all conversion credit to the last interaction that drove the converting session.
- First Interaction: all conversion credit to the first interaction that drove an immediate conversion or preceded a conversion on a return session.
- Linear: conversion credit divided equally by each session that led to a conversion.

Figure 8.43 In this example we’re using the Model Comparison Tool to compare channel performance using First Interaction, Last Interaction, and Linear models.
Figure 8.44 shows all available built-in models. Note that you can create your own models or customize any of the built-in models based on session recency before conversion, level of user engagement during the session, and many other factors.
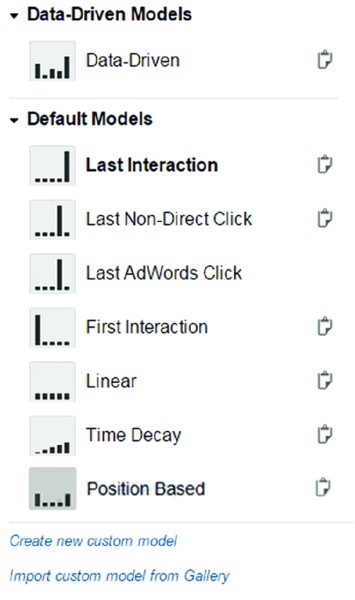
Figure 8.44 Built-in attribution models.
Note also that the Data-Driven Attribution model, discussed in Chapter 18, is available in Analytics 360 only.
Custom Channel Groupings
Page Value
The Page Value metric that appears as the last column in the All Pages report is perhaps the most misunderstood (and underappreciated) metric in GA. In general, we can say that Page Value indicates how much support a page is providing to goal (Destination and Event type, primarily) and Ecommerce conversions.
For each page, Page Value is calculated as:
As we remember from Chapter 4, the Unique Pageviews metric represents the number of sessions in which the page was viewed at least one time. When calculating Page Value, a page counts in the denominator of our equation only once, even if it was viewed multiple times in a session. Similarly, Goal Value and Ecommerce Revenue is added to the numerator only once, even if the page was viewed multiple times before the conversion took place, and the full Goal Value or Ecommerce Revenue is credited regardless of how many pageviews interceded between the given page and the conversion—as long as the conversion was completed after at least one of the pageviews occurred.
Figures 8.45 and 8.46 illustrate Page Value respectively for Ecommerce and for a nonmonetized lead generation goal to which we have assigned a goal value of $1. Note that even based on an arbitrary goal value in the second example, Page Value helps to identify pages that are—and are not—supporting the conversion process.

Figure 8.45 With Page Value based on actual Ecommerce revenue, we see that the Free Shipping page seems to be helping Conversions more than Privacy Policy.

Figure 8.46 Even with Page Value based on an arbitrary goal value of $1, we can see which pages are likely helping lead submissions.
Does Page Value provide an absolutely objective comparison of your pages’ conversion impact? Not completely, of course. Visitors who viewed the Privacy Policy page in Figure 8.43 may have already been experiencing some anxiety and have therefore been less likely to convert, while those viewing the Free Shipping page may have been seeking affirmation on a purchase that they had already nearly decided on.
Nonetheless, Page Value can provide an important aid to conversion analysis and optimization. If your Advisory Panel page has the highest Page Value as in Figure 8.44, you can revise your home page variation to more prominently display or link to Advisory Panel information, or—even better—you can set up an A/B test variation with these changes and measure the difference in conversion rate.
Conversely, if a page that you expected to help conversions is displaying a low Page Value, review the page for potential improvements or consider directing traffic away from that page and towards a page that is achieving higher Page Value.
Distinguishing between Goal Value and Ecommerce Revenue within Page Value
As shown above, Page Value calculation is based on all Goal Value and Ecommerce Revenue accrued in the given sessions, so how can you display Page Value based on one goal or Ecommerce revenue?
There are two approaches: segments or separate views. Let’s say specifically that within the same view, we have:
- Ecommerce tracking
- one goal configured with a £10 Goal Value
If you wanted to display Page Value based on either Ecommerce transactions or Goal completions alone, you could apply custom segments as shown in Figures 8.47 and 8.48 to remove sessions in which the goal conversion or the Ecommerce transaction occurred. (We discuss segments in Chapter 10.)

Figure 8.47 To display Page Value based only on Ecommerce Revenue, we can apply a filter to exclude sessions in which the goal conversion occurred.

Figure 8.48 To display Page Value based only on the Goal Value that we configured, we can apply a filter to exclude sessions in which Revenue (i.e., Ecommerce revenue) is greater than 0.
You may have noticed in the segments above that we would be inadvertently excluding, in both cases, those sessions in which both the goal and an Ecommerce transaction took place. Though this would probably not significantly skew our analysis, we always have the option (with Edit rights to the property) to create two additional views: one to track the goal only, and one to track the Ecommerce transactions only. In this way, Page Value as reported in these dedicated views would be based on all Ecommerce transactions or all completions of the £10 goal.
Integrating with Third-Party Shopping Carts
If you’re working with a third-party Ecommerce platform (or planning to), you’ll want to make sure to verify the level of GA support that the platform offers, for tracking in general and Ecommerce specifically. For hosted platforms such as Shopify, BigCommerce, and Volusion, cross-domain support is also a consideration, since you’ll want to make sure to maintain the session between your own domain and the hosted cart domain. (Cross-domain tracking is discussed in Chapter 12.) For self-hosted platforms such as Magento, cross-domain tracking does not pertain, since users won’t traverse domains for the ecommerce functionality.
 Key Takeaways
Goals and Ecommerce tracking are not retroactive. Don’t delay in setting up a goal for any action or engagement level that represents a success in terms of your KPIs, and Ecommerce (or Enhanced Ecommerce) for transactions that include a variety of products, price points, and so on.
Four goal types. You can create goals based on a pageview or screen view (physical or virtual), an event, or threshold of engagement (that is, pages/screens per session, or session duration).
Three match types for Destination goals. You can use the Equals To match type to match a single Page or Screen dimension value only, or you can use Begins With or Regular Expression for multiple pages or screens to count as a completion of the same goal.
Goal funnels are recommended but not required. If your conversion process is designed to include a series of pages or screens, create a Destination goal with a funnel.
Conversion rate is based on sessions. Conversion rate is calculated as conversions per session and therefore appears lower than if it were calculated as conversions per user.
Funnels do not affect conversion rate. Funnels populate the Funnel Visualization report and determine Abandonment Rate and Funnel Conversion Rate, but they do not affect Goal Conversion Rate. The only factor for calculating conversion rate for a Destination goal is the number of sessions in which the Destination page or screen was viewed.
Unlike goal tracking, Ecommerce tracking requires additional code. While goal tracking depends only on an Admin configuration and the page or event data that is already being recorded, the greater detail in Ecommerce tracking usually depends on additional back-end transaction data written to the data layer. For this reason, you normally need to work your developers to implement Ecommerce tracking.
Enhanced Ecommerce provides reporting on actions leading to the transaction. While Ecommerce reporting is much more detailed than goal reporting in terms of transaction data, it does not provide direct insight into the steps leading to the transaction. The additional coding steps required for Enhanced Ecommerce provide richer reports, including product impressions and adds-to-cart, promotion clicks, and checkout abandonment.
Use a test view first. Configure goals, Ecommerce, and Enhanced Ecommerce in a test view before your working view(s).
Multi-Channel Funnel reports show channels that assist conversions, not just Last-Click Attribution. The MCF reports provide critical reporting on the channels responsible for non-converting sessions that preceded converting return sessions from other channels.
Attribution models represent assumptions. With the exception of the algorithmic Data-Driven attribution model available in Analytics 360, each attribution model represents shows how conversion credit would be allocated to channels if a certain assumption (e.g., each session deserving equal credit) were true. Data-Driven attribution, available in Analytics 360, algorithmically assigns different percentages of credit to assisting channels.
Page Value indicates goal and Ecommerce support. You can interpret Page Value as an indicator of the support that a page—especially if it’s not designed as part of the conversion process—is providing to goal completions and Ecommerce transactions.
 Actions and Exercises
- Articulate the KPIs for your website or mobile app. Revisiting our discussion in Chapter 3, “Measurement Strategy,” make sure you have a very clear idea of a successful session.
- Set up goals, Ecommerce, or Enhanced Ecommerce. For your KPIs and any user action that indicates an increased level of interest (such as a contact-us submission), set up a goal or Ecommerce to correspond. If you can’t currently set up Enhanced Ecommerce tracking where it would be ideal, set up Ecommerce tracking; if you can’t set up Ecommerce tracking, set up a goal.
- Create goal funnels. Create funnels for your destination goals. You can review the Reverse Goal Path report for existing goals and map the most common paths to conversion as actual funnel steps and thereby measure step-to-step drop-off.
- Determine goal values. Using the guidance offered in the chapter, set suitable goal values for your goals. This is particularly important if you do not have Ecommerce tracking in place.
- Confer with your third-party shopping provider. If you’re choosing or currently using a third-party provider for Ecommerce processing, determine their support for GA pageview, Ecommerce/Enhanced Ecommerce, and cross-domain tracking as applicable.
- Review the Multi-Channel Funnel Reports and the Attribution Model Comparison Tool. Once goals and/or Ecommerce tracking are in place, review the MCF reports and the Model Comparison Tool. Which channels are performing best for the converting visit? Which channels are assisting conversions?