
12
Implementation Customizations
It’s a recurring theme: customizations in Google Analytics (GA) beyond the default implementation facilitate better analysis and greater insights. We’ve already examined several key steps in surpassing default data collection and reporting: event and virtual pageviews to track non-pageview interactions, goal and Ecommerce configuration to track successes, campaign parameters to clarify acquisition, and view filters or segmentation to amplify trends within a data subset.
In this chapter, we consider some important additional customizations that will allow GA to more closely reflect our organizations and our customer experiences and thereby make the reporting even more comprehensive, meaningful, and actionable.
Custom Dimensions
As we first saw in Figure 4.7, GA records many dimensions with each hit, so we do not, for example, need to explicitly tell GA the visitor’s operating system or the title of the page viewed. This is certainly a benefit, but let’s consider a broader issue: by default, GA captures a certain number of predefined dimensions only. This default data set does not always provide the information that you need about your visitors, your organization, or your content.
By taking advantage of custom dimensions, you can extend the default GA data set to encompass dimensions that are specifically about your organization, your content, your products, or your customers.
The limit per property for custom dimensions—that is, the number of different custom dimension slots you define, not the different values that you can populate for each custom dimension—is 20 for GA standard and 200 for Analytics 360. (The same limits apply to custom metrics, which we discuss below.)
Custom Dimensions: Article Author and Category
As a classic example of custom dimension usage, let’s consider a blog or a website that publishes articles. When we’re analyzing such a site, it would be useful to report metrics such as pageviews by category and author. Although we might somehow assume that GA captures the article category and author, this is not the case. These data points may appear in the Request URI that’s captured by default, but, otherwise, GA has no reliable way of recording this data on its own. It’s up to you to explicitly instruct GA to capture this data as custom dimensions that you can then use in your analysis (Figure 12.1).

Figure 12.1 Custom dimensions allow you to record elements such as article author and category, which GA would not specifically capture by default.
Implementation for custom dimensions involves two basic steps:
- Configure the custom dimension in the property admin.
- Record the custom dimension value with a hit.
As we’ll see below, the first step is quite straightforward, while the second step may require a little bit of consideration and development work.
Setting Up the Custom Dimension in the Property Admin
Because custom dimensions affect the data that all GA users see in any view within the property, you must have Edit access at the property level to complete the procedure below.
- In the Property column on the Admin screen, click Custom Definitions ˃ Custom Dimensions ˃ + New Custom Dimension.
- For Name, enter Author.
- For Scope, select Hit.
- Repeat the process, but with Category as the Name in step 2.
Custom Dimension Scope
That’s all there is to the admin setup for custom dimensions. Before we move on to the harder part—populating the custom dimensions—let’s discuss each of the four options that you can select for custom dimension scope. (For additional illustration of custom dimension scope, see “Custom Dimensions & Metrics” in the Google Analytics help pages: https://support.google.com/analytics/answer/2709828?hl=en.)
Hit As we saw in Figure 4.7, a hit describes each packet of data, such as a pageview or an event, that we send to GA. In our first example, our custom dimensions relate to specific article pages of blog posts, so they correspond to the pageview hit, and we’d therefore need to set the Scope to Hit. If you were specifying a custom dimension associated with an event, such as the author of a PDF download that you’re tracking as an event, you’d also use Hit as the Scope.
Session Session scope is suitable for an extra descriptor that you want to set about the session. If, for example, your mobile app users can display your screens in French, German, or English, you could set a Language Selected custom dimension at session scope (in addition to the built-in Language dimension that GA populates by default based on the user’s browser setting). You need to set a session-scope custom dimension only once per session. If you set a session-scope custom dimension with a different value during a single session, the previous value from that session is overwritten.
User Conceptually, session and user scope are closer to each other than either is to hit scope. A user-scope custom dimension is useful for designating a status that spans multiple sessions. For instance, you could set a user-scope custom dimension for purchaser custom status at the time of purchase; this would allow you to track purchaser activity even on return non-purchase visits—provided (for a Web property) that the visitor was using the same browser and the same device and did not delete cookies between sessions.
As another use case for user-scope custom dimension, let’s say that you store four customer status values on your back-end system based on your customers’ first purchase date: less-than-1-month, 1–6-month, 6–12-month, 1-year-plus. You can work with your developers to read the customer status from the back end (or to generate it dynamically from the back end based on date of first purchase) each time that a user logs in. The developers could write customer status to the data layer (or even to a simple JavaScript variable) on the page so you can read it into a custom dimension slot within your GA pageview tag in Google Tag Manager (GTM), as discussed later in this chapter. The advantage of user scope over session scope in this case: even if a visitor does not log in during a given session, the custom dimension will carry over from a previous session (again, in the case of a Web property, provided that the _ga cookie is present in the browser).
Product Product scope relates directly to a product in a basic or Enhanced Ecommerce transaction. While Enhanced Ecommerce already provides product variant as a “wildcard” variable that you can populate with any product data, you may have a need for additional slots. If, for instance, your online store sold vehicle accessories, you might want to use variant to store the make of the vehicle (Citroën, Hyundai, or Chevrolet), so you could use a custom dimension to store the type of vehicle (sedan or coupe).
Populating the Custom Dimension
Let’s return to our author and category examples. We’ve already set the custom dimensions up in the admin—that was the easier part. Now we have to populate the custom dimensions.
The most essential point about custom dimension implementation is that custom dimensions are not sent to GA on their own, but rather as part of a hit (even for custom dimensions set to a scope other than hit). The custom dimensions are recorded the same way that the page, traffic source, and screen resolution values are recorded: as part of a hit encapsulating many dimensions. A custom dimension extends the data set recorded in a hit, but it does not constitute a hit unto itself.
All that said, how do we add the custom dimension to the hit? Here’s the first question you’ll want to ask in the case of our previous example: Do the author and category already appear somewhere in the text or markup of the page or in the URL? If yes, you can use a GTM variable to read the value.
If author and category text doesn’t appear anywhere on the page, in the page source, or in the URL, you will need to ask your developers to bring them from the back end into the page as data layer variables (as shown in Listing 12.1) (or regular JavaScript variables).
We can use the author and category variables configured either as in Figure 12.2 or as in Figure 12.3 to populate the custom dimensions within a GA tag in GTM.

Figure 12.2 We’re reading the author value from the page text—specifically, the second span tag within the div tag that has footer as class.

Figure 12.3 If author and category don’t appear in the page, and you instead work with your developers to populate them into the data layer, you can read them in with simple GTM data layer variables.
Ensure that the Custom Dimension Values Are Available When the Tag Fires
If we’re sending the custom dimensions as part of a pageview hit, we'll need to make sure that the data layer reference in Listing 12.1 appears above the GTM container code in the page so the data layer is already populated when the GA tag fires.
As another option, we can apply a DOM Ready trigger to the tag, as we saw in Chapter 5, “Google Tag Manager,” and Chapter 6, “Events, Virtual Pageviews, Social Actions, and Errors.” By using the DOM Ready trigger type, we’ll make sure that the data layer has been populated with the author and category values before the GA pageview tag tries to read them in as data layer variables (Figure 12.4). And if we’re reading author and category from anywhere within the page text or markup, we’ll certainly want to make sure to use the DOM Ready trigger type; otherwise, the GA pageview tag could fire and try to pull in author and category text as custom dimensions before the page text has even been parsed in the browser.
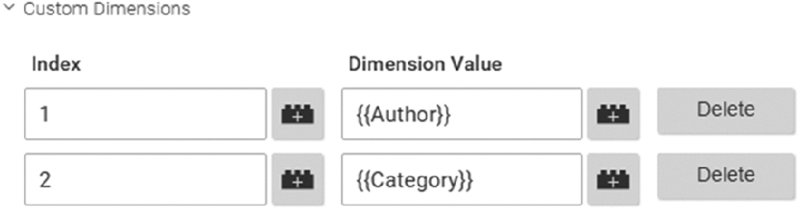
Figure 12.4 You populate custom dimensions within a GA tag (usually pageview or event) in GTM. The index corresponds to the order in which you created the custom dimensions in the property admin. The dimension values are normally set to GTM variables that read from the data layer or the page text/markup.
Custom Dimension in Apps
The way you have implemented overall GA tracking for your mobile app will dictate how you will populate any custom dimensions from your app. If you are tracking your app through GTM, you can use GTM variables to read in custom dimensions that you have populated into the data layer or that serve as the return value of a function call. If, instead, you’re tracking your app through the iOS or Android SDKs, you can include the custom dimensions within the hits you record programmatically. (We discuss mobile app tracking in Chapter 13.)
Using the Custom Dimensions within the GA Reports
You won’t directly find Custom Dimensions within the left navigation of the GA reporting interface; instead, you can use Custom Dimensions primarily in the three following ways:
- as a dimension in a custom report, as shown in Figure 12.5
- as a secondary dimension within built-in (and custom) reports
- in a segment definition

Figure 12.5 In this custom report, we’ve defined Author as the primary dimension.
Custom Dimensions are also available for export through the GA APIs, as demonstrated in Chapter 15, “Integrating Google Analytics with CRM Data.”
12.2.2 Custom Dimension: Login Status
Another piece of data that GA cannot determine on its own—even though it somehow seems that it would—is login status. By setting logged-in as a session-scope custom dimension, we can see differences in behavior between visitors who are and are not logged in.
Since a user generally logs in once only during a session, and since a session-scope custom dimension does not need to be sent with every pageview hit, we can consider using a one-time event to record the custom dimension at the time of login. You can work with your developer to execute the code in Listing 12.2 when the user logs in: the code will populate the eventTracker value for the event variable into the data layer, which will fire the Custom Event trigger applied to the “catch-all” event tag that we first discussed in Chapter 6. The other values that we’re populating into the data layer include the event category, event action, and loginStatus, which we can read into the event tag with GTM Data Layer variables. (Keep in mind that event label is optional, so we don’t need to populate it in this example.)
We can now perform three additional steps to populate the custom dimension value into GA:
- Configure the custom dimension in the Property admin, setting the scope to Session.
- Set up a GTM Data Layer variable to read in loginStatus.
- Modify the catch-all event tag in Figure 6.31 to read in the loginStatus Data Layer variable as a custom dimension, as we did for author and category in Figure 12.4.
If we’re populating the custom dimension only when a login occurs, the value would be (not set) for all non-login sessions. If you so chose, you could use a view filter as described in Chapter 9, “View Settings, View Filters, and Access Rights,” to rewrite (not set) to notLoggedIn for the loginStatus custom dimension.
You could use an approach similar to Listing 12.2 to read in customer status/ designation from your back end system on login and record as a custom dimension, as the example custom report in Figure 12.6 demonstrates. As mentioned earlier, however, a user-scope custom dimension would be more suitable for customer status, and this scope would allow GA to record this custom dimension even for interim sessions in which a login did not occur.

Figure 12.6 In this custom report, we’re reporting Ecommerce metrics by Customer Status, which we read in from the back end and stored in GA as a user-scope custom dimension.
Custom Dimension: Form Selection
Another handy use case for custom dimensions is the storage of form selections. A lead generation form on your website, for example, could contain a variety of drop-downs, radio button selections, or text fields such as:
- Age group
- Gender
- Occupation
- Industry
- Product or service interest
- Postal code
To generate a custom dimension that records industry selection, we can add the script in Listing 12.3 into a GTM Custom HTML tag. Since this script uses jQuery to find and configure the Industry drop-down to write to the data layer when the selected value changes, we’ll certain want to apply a DOM Ready trigger to the Custom HTML tag so the drop-down element has been parsed before the Custom HTML tag fires. Since we’re writing eventTracker as the event variable, our “catch-all” event infrastructure will again be activated.
Content Grouping
Content grouping is similar conceptually to hit-level custom dimensions for pages. A significant difference is that content groupings are available within two of the built-in reports: Pages and Landing Pages.
Let’s consider the same use case for content groups as we did for custom dimensions in Figure 12.1. Instead of—or in addition to—using hit-level custom dimensions to capture article author and category, we can use a similar process to populate content groups, as described below.
Configuring the Content Grouping
Somewhat surprisingly, you configure a content grouping in the View Admin and not the Property Admin. To create the content grouping, click Content Grouping ˃ + New Content Grouping, supply a Name such as Sport, and click Save.
Populating the Content Groups
In most cases, you’ll populate the content groups similarly to custom dimension population in Figure 12.4; that is, we add the content group to the pageview hit.
As explained above for the category or author custom dimension, we can configure a GTM variable to read in the sport from anywhere in the page text or markup. If the sport doesn’t already appear anywhere in the page, your developers can write the sport to the data layer, from which you can read it with a data layer variable similar to Figure 12.3. The same considerations outlined above regarding the DOM Ready trigger would apply for content group population.
Populating the Content Group Based on Rules or Extraction
When you’re creating a content grouping in the View Admin, you see that direct population of the content group name as shown in Figure 12.11 is not the only option—you can also populate the content groups based on matching or extraction from page URL, page title, or screen name.

Figure 12.11 With Sport set up as the first-slot content grouping in the View Admin, we can read the sport value into the Pageview tag as a DOM Element or data layer variable as shown in Figures 12.2 and 12.3
While this is useful, you may want to consider that content grouping may be slightly less of a priority if, for example, you can also view all pages related to basketball just by filtering the default Pages report. Also, if your URL structure is already very hierarchical, content grouping may be somewhat redundant. If all of the pages on your website that deal with basketball were already located in the /basketball directory, the Content Drilldown report would essentially provide metrics by content group.
For more information on the extraction method, see “Capture Groups and Content Grouping” in the GA help pages (https://support.google.com/analytics/answer/3333221?hl=en).
Custom Metrics
It can be argued that your GA implementation is not complete without at least a few custom dimensions (or content groups) to reflect your own organization. Custom metrics, conversely, are more specialized, and their use cases more limited.
That said, they can serve a unique and critical purpose in certain tracking scenarios. Let’s say that Health Canada, the public-facing digital service of the Health Ministry, has just created an initiative called Canada Walks/Canada Se Promène for Canadians to commit to walking a certain number of kilometers per week for exercise. Citizens can visit the Health Canada website and sign up to receive weekly email reminders for their walks.
On the signup form, would-be walkers can enter the number of kilometers they pledge to walk each week. This detail will be included in the reminder emails.
If you were responsible for analytics on the Health Canada website, you could take advantage of a custom metric as follows to track the number of weekly walking kilometers pledged and then configure a custom report as in Figure 12.12.

Figure 12.12 Kilometers Pledged appearing as a custom metric in a custom report.
Configuring the Custom Metric
To configure the custom metric to record the kilometers pledged:
- In the property admin, click Custom Definitions, Custom Metrics, + New Custom Metric.
- For Name, enter Kilometers Pledged.
- For Scope, select Hit.
- For Formatting Type, select Integer.
Populating the Custom Metric
Populating a custom metric is similar to populating a custom dimension: we’ll need to include it in a GA tag—usually a pageview, event, or Ecommerce transaction—as a custom metric value.
In this example, we do read the custom metric directly from a page element through a Custom JavaScript variable, but if the kilometers pledged had not been available in the DOM, we would have had to work with our developers to first write to the data layer so we could read it with a Data Layer variable.
- Variable. Create the variable shown in Figure 12.13 to read the value from the Kilometers Pledged form field.
- Tag. Create a GA event tag as in Figure 12.14 that reads the variable in as a custom metric and populates it into the first custom metric index in the property, which we configured above. (You can specify any suitable values for Event Category, Event Action, and Event Label.)
- Trigger: Enable the built-in Form ID variable, and apply the form trigger shown in Figure 12.15 to the event tag.

Figure 12.13 This Custom JavaScript variable reads the value of the kilometers field of the walk pledge signup form.
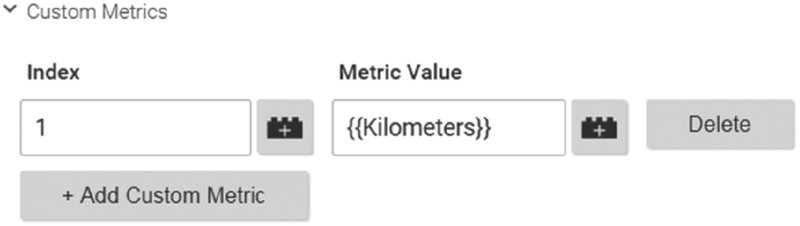
Figure 12.14 In the GA Event tag, we’re populating the Kilometers variable as a custom metric.

Figure 12.15 This trigger will fire the Walk Signup event when the signup form is submitted.
As a different approach, we could have opted for a bit of jQuery in a Custom HTML tag to write the kilometers pledged to the data layer on form submit, along with the other data layer variables needed to active and populate the catch-all event.
Formatting Type and Scope
In addition to Integer, the other custom metric Formatting Types available for custom metric setup are Currency and Time, and the other Scope besides Hit is Product. As two additional examples of custom metric, you could configure a Time custom metric with Hit scope to record total hours of video watched or a Currency custom metric with Product scope to record discount amounts in Ecommerce transactions.
Also note that all custom metric Formatting Types represent totals, not percentages or ratios. If we wanted to instead calculate the number of kilometers pledged per user or form submission, we would need to use our custom metric within a calculated metric formula. Calculated metrics are discussed below.
Calculated Metrics
In additional to custom metrics, which you configure and populate directly as discussed in the previous section, you can now also calculate new metrics based on existing metrics (both built-in and custom) and numeric constants. Many of the examples of custom metrics, such as those below, involve conversions (goal and Ecommerce) and/or users (instead of sessions).
Conversion Rate Based on Users
Although we may be inclined to think casually of conversion rate as the number of people who complete a goal, it’s critical to remember that conversion rate in the built-in GA reports is based on sessions rather than users. As Figure 9.6 demonstrates, this definition can make conversion rate seem surprisingly low to managers, clients, and so on, especially for a more ponderous or complex conversion.
The Multi-Channel Funnel ˃ Path Length report indicates the number of times that visitors return before completing a goal, but we can also create a calculated metric that is based on users as detailed below. In our example, we’ll calculate user-based conversion rate for submission of an application for a training program enrollment application.
- In the View column of the Admin screen, click Calculated Metrics.
- Configure the calculated metric as shown in Figure 12.16.

Figure 12.16 Calculated metric for Goal 1 Conversion Rate based on users rather than sessions.
We’d need to keep in mind that the number of users reported in GA is still higher than the number of individuals who are visiting your website (due to cookie deletion, etc.), but conversion rate based on users rather than sessions may be significantly higher than the built-in session-based conversion rate and would provide a closer approximation of the percentage of individuals who are converting. In a GA mobile app property, the Users metric is likely a fairly accurate indication of the number of people who are actually using your app, so built-in metrics based on Users in mobile app properties should reflect per-person metrics fairly accurately.
For more on user-based conversion rate, see www.e-nor.com/gabook.
Non-Bounce Conversion Rate
As we saw in the Non-Bounce Sessions discussion in Chapter 10, “Segments,” it can be useful to evaluate performance based on non-bounce sessions, particularly for websites: since our website will always experience some degree of bounce, why not instead track metrics for those users who were engaged enough to view another page or complete an action that you have tracked as an event?
We could certainly apply the built-in Non-Bounce Sessions segment to any of the goal reports, but we could also create a calculated metric specifically for non-bounce conversion rate as shown here.
{{Lead Submitted (Goal 1 Completions)}} / ({{Sessions}} - {{Bounces}})Several additional considerations about calculated metrics should be noted:
- To configure a calculated metric, you must have Edit access at the view level.
- In a calculated metric definition, you can include built-in metrics, your own custom metrics, and numeric constants.
- Formatting types include integer, percent, float, currency, and time.
- Once you create a calculated metric, you can’t rename it, but you can delete it.
- Calculated metrics are retroactive.
- Calculated metrics don’t appear in built-in reports, but you can use them in custom reports (and query them through the GA Core Reporting API).
Demographics and Interests
As discussed in Chapter 2: “Google Analytics Reporting Overview,” the Demographics and Interests reports are not enabled by default. To enable the Demographics and Interests reports, you should only have to toggle the Enable Demographics and Interest Reports to the ON position in the Property Settings. Within each view, you’ll also need to enable the Demographics and Interests reports as prompted the first time that they are accessed.
If for any reason, the Demographics and Interests reports to not begin populating, you can select the Enable Display Advertising Features checkbox in the GA tags in Google Tag Manager, as shown in Figure 5.4 and in many of the other GA tags throughout the book (and then republish your container, of course). (This setting appears as Enable Advertising ID Features for GA tags in a mobile app container.)
Privacy Policy
To remain in compliance with the GA terms of service when enabling the Demographics and Interests reports, you should update your privacy policy similarly to the following to reference the DoubleClick cookie and demographics and interests information.
This website uses the first-party Google Analytics cookie only to track your return visits but not to identify you personally by name, email, or any other data. This site also uses the third-party DoubleClick cookie to enable reporting on demographics and interests information (such as age, gender, and favored product categories), but, again, not in any way that is associated with personally identifiable information.
If you enable remarketing as discussed in Chapter 14, see “Policy Requirements for Google Analytics Advertising Features” in the Google Analytics help docs for privacy policy requirements.
Along these same lines, it’s advisable to check with your legal or compliance advisors before enabling Demographics and Interests or remarketing in GA.
If you do not enable Demographics and Interests or remarketing, the terms of service still require you to include basic verbiage about the first-party Google Analytics cookie, as shown in the example above, for overall tracking.
For mobile app tracking, change the cookie references in the privacy policy to anonymous identifiers.
Enhanced Link Attribution
Thus far in the book, we have not discussed the Behavior ˃ In-Page Analytics report. The report can be problematic (especially across domains and http/https pages), and, overall, GA is not a full-featured overlay reporting tool such as CrazyEgg, HotJar, or SessionCam. That said, In-Page Analytics can be useful so it makes sense to enable Enhanced Link Attribution in the GA Pageview tag in Google Tag Manager as shown in Figure 12.17.

Figure 12.17 You can easily enable Enhanced Link Attribution in the GA pageview tag in GTM.
Enhanced Link Attribution offers two main benefits to the In-Page Analytics reports and to the Page Analytics plug-in for Chrome, which generates overlay reporting very similar to In-Page Analytics (and which tends to work more reliably):
- Show different percentages for two or more links that direct to the same other page. If, for instance, you have an About Us link in both your header and footer, Enhanced Link Attribution allows GA to display different click percentages (3.0% and 0.5%, for example) instead of 3.5% for both links.
- Show click percentages on JavaScript-driven page elements. Enhanced Link Attribution also allows GA to display separate click percentages for elements in a JavaScript drop-down menu and other JavaScript-driven page elements.
As a related discussion, see Appendix A for Alex Harris’s guest spot on using both quantitative GA data and third-party overlay reporting for quick wins in landing page optimization.
Tracking Info Customizations
You can configure the following customizations under Tracking Info in the Property Admin.
Session Timeout
In Session Settings, you can change the session timeout from the default of 30 minutes to a minimum of 1 minute through a maximum of 4 hours. If your website or app is designed for steady user interaction—for active stock quoting, as an example—and a break in activity of even less than 30 minutes might logically signal the end of a session, you could consider decreasing the session timeout. If, however, your user experience is designed for long durations on a single page or screen, you could increase the session timeout to align with practical usage.
In the latter case, however, you would probably want to send additional hits to GA, even while the user is on the same page, by configuring event tracking for page scroll or for video view percentages (as discussed in Chapter 6). With additional hits being sent to GA even while the user remains engaged on a single page or screen, it would be unnecessary to increase the session timeout, since the default 30-minute timeout would refresh with each hit.
It is normal practice overall to leave session timeout to the 30-minute default. If you change this setting in an existing implementation, make sure to create an annotation as described in Chapter 11 to refer to when you’re analyzing session counts over a period that straddles the change.
Campaign Timeout
Campaign timeout is illustrated in Figure 7.23. The Campaign Timeout, which appears in Session Settings, determines the duration for which a direct session will appear in the GA reports as a more specific traffic source from a previous session. While you can change the Campaign Timeout to a longer or shorter window for the direct override, it is considered normal practice, as with session timeout, to maintain the default.
As a note, the Campaign Timeout does not affect the Multi-Channel Funnel or Attribution reports, since these reports do not apply the direct override.
Organic Search Sources
GA maintains a list of search engines against which it compares incoming traffic. If it finds that the clickthrough originated from one of the websites on the search engine list, that session is assigned the organic medium rather than referral. This list is comprehensive, but if you do happen to see websites in your Referrals report that you instead want GA to consider as search engines, you can add that domain (newsearchengine.com, for example) as an organic search source.
Recording Country-Specific Search Engines
It may be a bit surprising that, by default, clickthroughs from google.in or google.it appear in GA with a source value of just google, and that fr.yahoo.com appears as yahoo.
To break out country-specific search engines as their own sources, you can list them as separate Organic Search Sources, as shown in Figure 12.18.

Figure 12.18 For country-specific search engines to appear as sources in GA, you need to add them as organic search sources.
Recording Google Image Search as a Source
The procedure for recording clickthroughs from Google images is not as straightforward as for country-specific search engines: adding images.google.com as an Organic Search Source does not work.
By default, Google image clickthroughs are recorded with referral as the medium and google.com/imgres or google.co.uk/imgres as the source. To rewrite the medium to organic and the source to images.google.com, images.google.co.uk. or any other country-specific Google image search results page, we can apply the filters shown in Figure 12.19 and Figure 12.20 to our view. (As emphasized in Chapter 9, you should always validate view filters in a test view before applying them to any working view.)

Figure 12.19 This first filter matches the original source and medium values for Google image clickthroughs and rewrites the medium as organic.

Figure 12.20 With medium rewritten to organic, this second filter still matches the original source, and the output constructor adds com or co.uk extracted as the wildcard in Field A.
Referral Exclusion List
When a clickthrough occurs from a domain included in the Referral Exclusion List, GA does not begin a new session, and the medium and source values of the current session are maintained. Referral exclusions have two general use cases:
- Detour to another domain. If, for instance, your checkout path diverts users to a third-party service on another domain (such as PayPal) before they return to your own site (for confirmation, etc.), you’ll need to make sure to list that other domain as an exclusion—otherwise, when the user returns to the confirmation page on your site, a new session will start, with medium as referral and source as the domain of the other website.
- Cross-domain tracking. As discussed later in this chapter, we’ll also use referral exclusions to maintain session, medium, and source (and campaign as applicable) across domains as part of cross-domain tracking.
Search Term Exclusion List
The Search Term Exclusion List allows you to specify organic keywords—normally, the branded/navigational keywords that we discussed in Chapter 7, “Acquisition Reports”—that will prompt GA to count the organic clickthrough as direct. With most organic clickthroughs, even most organic branded clickthroughs, now recorded with (not provided) as the keyword, the utility of the Search Term Exclusion list has become very limited. (In other words, just keep it blank; it no longer has much of an effect.)
Cross-Domain and Roll-Up Reporting
In most cases, a single GA property corresponds to a single website (or app), but this does not always need to be the case. There are two overall use cases for tracking more than one website within a single property:
- Cross-domain. Needed when there is a continuity of user experience across two domains that you manage, such as www.mysite.com and www.myblogsite.com or www.myproductsite.com.
- Roll-up. Suitable when there is an organizational need for integrated reporting on two or more domains that are unrelated from a user standpoint.
To assess your need for cross-domain or roll-up reporting, you can ask the following questions:
- Do I need to track multiple domains? If not, neither cross-domain nor rollup tracking pertains.
- Do the two or more domains offer a continuous user experience (in terms of branding, process, navigation, etc.)? If so, you should implement cross-domain tracking.
- Are the two or more domains separate in terms of user experience? If so, it’s perfectly acceptable and routine to track each domain in a separate GA property. If, however, you must provide consolidated, multidomain reporting within the organization (to upper management, for example), roll-up reporting offers the right solution.
Cross-Domain Tracking
There are a couple of fundamental yet surprising facts about GA tracking that we must consider to before configuring cross-domain tracking.
Surprising fact 1: The tracking ID for any property will track data from any domain. Yes, that’s correct. If I create a new property, and set the Website URL to http://www.abc123.com, and the Property ID for that property is UA-12345678-1, I can deploy a GA tag in GTM on www.xyz456.com with the property ID set to UA-12345678-1, and GA will still record data, even though the tracking is occurring on a completely different domain.
Surprising fact 2: Surprising fact 1 is not enough for cross-domain tracking. Once recovered from the first surprise, we may want to believe—since any tracking code will record data on any domain—that all we need to do to implement cross-domain tracking is to track with the same property ID on multiple domains. This is largely true for roll-up reporting, as we discuss later, but for cross-domain tracking to work correctly, there are some straightforward but important additional configurations required, as outlined below.
Maintaining the Session
The key concept in cross-domain tracking—and the differentiator from roll-up—is session maintenance. Using the same default GA tracking on two or more related domains such as site.com, blogsite.com, and productsite.com would cause the following problems:
- New session. As soon as the user traversed domains, the first pageview on the second domain would be considered part of a new session by a new user (since GA will create a separate cookie for the second domain with a different client ID).
- Original Source/Medium lost. As arguably an even graver problem, the original Source/Medium is lost in the new session on the second domain, replaced with site.com/referral. If we have designed our user experience to flow from site.com to productsite.com as in Figure 12.21, it’s basically useless to attribute user actions on myproductsite.com, including conversions, to mysite.com/referral. If a conversion takes place on myproductsite.com, we need to be able to attribute that conversion to AdWords or an email campaign or whichever source/medium originally drove the visit to mysite.com.

Figure 12.21 For cross-domain tracking, you must make configuration changes to maintain the session when the user crosses domains.
Outlined next are two additional steps you’ll need to take for cross-domain tracking (in addition to the recommended view filter shown in Figure 12.27, later in this chapter).
Cross-Domain Settings
To maintain the session in cross-domain tracking, you’ll need to make changes to the GA pageview tag in GTM as indicated in Figures 12.22and 12.23By setting allowLinker to true, GA will actually add the client ID from the first domain to the URL when the user clicks a link between domains, and GA will then read the same client ID out of the URL and into the _ga cookie on the second domain, thus identifying a single user who has traversed domains.

Figure 12.22 For cross-domain tracking, specify a value of true for allowLinker in the GA tag.

Figure 12.23 In Auto Link Domains, list the domains that you need to track across.
In addition to these settings in the GA tag in GTM, you’ll need to add the domains to the Referral Exclusion List in the Property Admin as discussed above.
Verifying Cross-Domain Tracking
You can take the following steps to verify that cross-domain tracking is working correctly.
-
Check for the client ID in the URL. When you click from site.com to productsite.com or blogsite.com, the URL should contain the client ID as well as a hashed timestamp (which appears as 1362114490410 in the example URL below). As a note, GA expires the client ID portion of the URL after two minutes based on the timestamp; this ensures that the same client ID won’t be used repeatedly in case the user shares the URL.
http://www.productsite.com/?_ga=1.182699591.1412315536.1362114490410
- Check the Real-Time reports. Start by identifying your own session in the Real-Time reports as described in the “How Can I Isolate My Own Session within the Real-Time Reports?” sidebar in Chapter 6. When you click between domains, verify the following:
- Active Users count does not increment.
- Medium and source do not change—if you see referral as the medium and site.com as the source, cross-domain tracking is not working correctly.
Roll-Up Reporting
As mentioned previously, the concept of roll-up applies when the reporting needs to be aggregated within a single property for domains that are completely separate in terms of branding, offerings, and user experience and that do not link to each other.
Let’s say that the Amalgamated Turbines Corporation maintains three websites: windturbine.com, jetturbine.com, and industrialfan.com. Since these sites are designed for completely different audiences, there’s no reason to link between them or to set up cross-domain tracking.
Managers and executives, however, may want to see consolidated reporting for all three sites: this is the purpose of roll-up reporting. You can implement roll-up reporting by including the identical GA tracking code on all three websites; none of the additional configurations mentioned above for cross-domain are necessary for roll-up. It is, however, still recommended to apply the hostname filter shown in Figure 12.24.

Figure 12.24 You can implement roll-up reporting by including the same tracking code, without modifications, in two or more websites.
As another option for rollup, you could configure the GTM containers on each of the websites with two sets of GA tags: one that tracks to the rollup property, and one that tracks to a property for that website only, in which case we would not need to create separate views with filters as in Figure 12.29.
Mobile App Roll-Up
You can create a roll-up of one or more apps in the same way as for websites: use the same property in multiple apps. Note, however, that for the recommended filters shown in Figure 12.27 and Figure 12.29 later in this chapter, you’d need to use Application Name in place of Hostname.
Theoretically, you could roll up a Web property with a mobile app property, but since the reports, metrics, and terminology reflect only one property type or the other, it’s quite awkward to include Web and app data within a single property and generally not recommended.
As a separate discussion later in this chapter, we’ll learn about cross-device tracking. For cross-device tracking as well, it’s strongly recommended to maintain a Web property (accessed on desktop, tablet, or smartphone) separately from a mobile-app property (accessed on tablet or smartphone).
Subdomain Tracking
If you need to track multiple subdomains, such as www.mysite.com and news.mysite.com, you can begin by again asking some basic questions about user experience and reporting needs.
- Do the two or more subdomains offer separate, unlinked user experiences? If so, you can track the two subdomains as completely separate properties. As another option, you could essentially create a roll-up of the subdomains by including the same property ID in the GA tracking for the two subdomains, and you can ensure that separate cookies are written for each subdomain by specifying www.mysite.com and news.mysite.com for as the respective cookieDomain values in the Fields to Set section of the GA tags within GTM for the two websites. In this way, the subdomains would appear as referrers to each other when users crossed subdomains (that is, the session would not be maintained), but the roll-up property would still provide consolidated reporting across the subdomains.
- Do the two or more domains offer a continuous user experience (in terms of branding, process, navigation, etc.)? For subdomains, this will often be the case. You can use the same tracking code on the multiple subdomains, but you’ll need to set the cookieDomain to mysite.com as shown in Figure 12.25 to prevent GA from writing separate cookies for each subdomain. As a note, auto as a cookieDomain value is also intended to set the cookie domain to the root domain, but since auto may function differently in certain cases—specifically for two-part top-level domains such as .co.uk—it’s advisable to hard-code the cookie domain for tracking across subdomains.
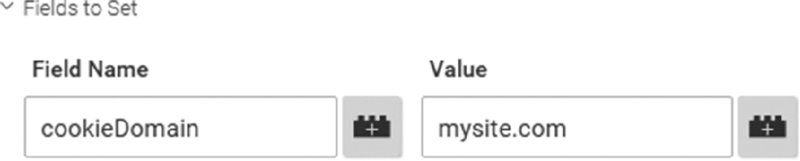
Figure 12.25 To keep the same cookie across subdomains, set cookieDomain to your root domain.
Applying View Filters to Disambiguate Domains
A downside to including multiple domains or subdomains in a single property is that the pages are not distinguishable by domain or subdomain—within the Pages report, for example, as shown in Figure 12.26—unless you add Hostname as a secondary dimension or apply an individual Hostname as a custom segment.

Figure 12.26 By default, you can’t distinguish between different domains or subdomains unless you add Hostname as a secondary dimension or an individual hostname as a custom segment.
For the full domain name to appear as the Page (also called Request URI) value, we can apply a view filter as shown in Figure 12.27. Note that we’re extracting the entire Hostname and original Request URI as (.*) regex capturing groups and outputting both into the final Request URI. With the filter applied, the Page dimension values are disambiguated as in Figure 12.28.

Figure 12.27 Custom view filter that prepends hostname to Request URI.

Figure 12.28 With the view filter in Figure 12.25 applied, GA includes hostname in the Page dimension.
Dedicated View for Each Domain or Subdomain
As an additional best practice when you’re tracking more than one domain or subdomain in a single property, you can create dedicated views for each domain or subdomain by applying a view filter that includes only a single hostname as shown in Figure 12.29. By applying the filter shown previously in Figure 12.27 to our main view and also creating dedicated views for each domain and subdomain, we have the best of both worlds: aggregated (but disambiguated) reporting across domains and subdomains, and dedicated reporting for each domain or subdomain.
In the case of roll-up reporting for apps, you can use Application Name in place of Hostname for the filters shown in Figure 12.27 and Figure 12.29.

Figure 12.29 With this view filter applied, we’ll display data for windturbine.com only (with or without www.).
Cross-Device Tracking with User ID
Life used to be simple (only a few years ago): people accessed your website from one device—namely, their desktop computers. You measured their actions, and that was the end of it.
Nowadays, visitors frequent your site from their laptops at work, then during lunch they’ll check a promotion on their smartphones, and in the evening, on their tablet, they’re convincing their significant others of the dire need that led them to buy your product.
It’s great that these visitors had such an affinity with your brand and ended up making a purchase. By configuring cross-device tracking in GA, you can follow the journey throughout the Awareness-Consideration-Purchase cycle—as long as the user is authenticated, as we’ll see below.
Authentication Required
Cross-device tracking is extremely useful and quite straightforward to configure, but it does not perform magic. As mentioned above, this feature works in an environment where you have an authenticated user experience (i.e., users are signing in). The authentication provides the common key that enables the cross-device tracking.
Admin Setup
Similarly to custom dimensions, custom metrics, and content groups, which you must first set up in the admin interface and then populate within hits that you send to GA, cross-device tracking also requires Admin setup followed by a User-ID value passed in the GA hits. In the case of cross-device reporting, we’ll create one or more User-ID-enabled views for the property. When GA then receives hits that contain User ID, it will populate the Cross-Device reports within the User-ID-enabled views.
To set up a User-ID-enabled view that will display the Cross-Device reports:
- In the Property Admin, click Tracking Info ˃ User-ID.
- Agree to the User-ID Policy, which prohibits you from passing PII to GA as the User-ID value.
- Keep Session Unification set to ON. (This will allow GA to pull in hits from an authenticated session before the login occurred.)
- Click Create to create the User-ID-enabled view.
Populating the User ID
For this step, you’ll need to work with your developers to retrieve a unique but anonymous id for each logged-in user and typically write that ID to the data layer from the back end so we can pull it into GA through GTM. Note that you will need to include the User ID in every hit that you send to GA, so you should update all your GA tags—pageview, event, social, and Ecommerce—to read in the User ID as shown in Figure 12.30 so that these hits will be included in the User-ID-enabled view.

Figure 12.30 For a hit to be included in the User-ID-enabled view (and therefore the Cross-Device reports), you need to populate the userId field, with a unique User ID that your developers have normally pushed into the data layer from your authentication system.
Send User ID with Each Hit While the User Is Authenticated
Sending the User ID to GA with each hit requires two overall steps, described next.
Persist User ID
Since the User ID is required for each GA hit (to appear in the cross-device reports), the User ID must be accessible on each page while the user is authenticated. We can’t just write the User ID to the data layer when the user logs in and then access the User ID in the data layer again on subsequent pages: the GTM data layer is flushed as soon as the user accesses another page. (The GTM data layer for mobile apps, conversely, does persist across screens. Cross-device tracking for mobile apps is discussed below.)
Depending on your authentication system, you might define the GTM {{User ID}} variable that appears in Figure 12.8 as follows:
- Data layer: you can work with your developers to push a User ID value to the data layer each time that a user accesses a page while authenticated. This is perhaps the most common solution and would offer the best option if your organization did not wish to expose a User ID value on the page, in the markup, in the URL, or in a cookie. From the data layer, you could read the User ID with a Data Layer variable.
- DOM Element: if the User ID is exposed on the page or in the markup, you can read it in through a DOM Element variable in GTM.
- URL: if the User ID appears as a query parameter (e.g., http://www.mysite.com/?userid=123xyz), you can parse it out through a URL variable in GTM with Component Type of the variable set to Query. If the User ID appears as a fragment (e.g., http://www.mysite.com/#123xyz), set Component Type to Fragment.
- Cookie: if for any reason it was not feasible to write the User ID to the data layer on each page load, you could store the User ID in a cookie when the user first authenticated and then read the cookie into your GA tags with a Cookie variable in GTM.
Unset the User ID on Logout
As soon as the user logs out, you are no longer permitted (by the GA terms of service) to send User ID with the hit, so you must make sure that you can no longer read it in through any of the variables listed above. If you have stored User ID in a cookie, you must delete the cookie on logout. If you have stored it in the GTM data layer for a mobile app, set the user ID variable in the data layer to undefined as soon as the user logs out.
Update All GA Tags to Send userId
As mentioned above, for each GA tag in GTM—including pageview, event, Ecommerce, and social—you should populate the userId field as shown in Figure 12.30. Again, this extra field will pertain only to User-ID-enabled views; in all other views, it will be ignored.
Additional Considerations for Cross-Device Tracking
Keep the following in mind:
- Read and agree to the User ID policy. (You have to agree to it before you enable it, as detailed in the setup procedure above.) If your developers are on a time crunch, ensure you have signoff from your legal department ahead of getting the developers involved.
- Again, don’t pass PII as a User ID.
- Use a clear and meaningful naming convention for the User-ID-enabled views, for example, User ID Main, or User ID Europe Only.
- You can configure goals, view filters, view settings, content groupings, AdWords linking, and Remarketing (discussed in Chapter 13) for a User-ID-enabled view just as you would for a non-User-ID-enabled view.
- The maximum lookback for the Cross-Device reports is 90 days.
Cross-Device Reports
Once the User-ID implementation and configuration are completed, you’ll get to enjoy the three Audience ˃ Cross-Device reports within the User-ID-enabled view.
Device Overlap
As shown in Figure 12.31, the Device Overlap report can display not only device overlap between sessions for authenticated users (who generated at least one session during the selected time period); it can also display which combination of devices across sessions drove revenue.

Figure 12.31 The Device Overlap report can display overlap not only for sessions but also for revenue that was accrued in different combinations of cross-device sessions.
Device Paths
More granular than the Device Overlap report, the Device Paths report shows specific pass-offs from one device to another (before or during the selected time period). If we examine row 9 in Figure 12.32, for example, we see that 112 users generated (during the selected time period) one or more sessions on Desktop, then one or more sessions on Mobile, and then one or more sessions on Desktop, for a total of 1,641 sessions and $69,281.35 in revenue.

Figure 12.32 The Device Paths report breaks down Users, Sessions, and Ecommerce metrics by pass-offs between device categories.
Acquisition Device
The Acquisition Device report in Figure 12.33 displays three rows only, corresponding to each of the three device categories. Row 2 indicates that 763 users who originated on Tablet (before or during the selected time period) generated $574,402.72 in revenue (during the selected time period) on Tablet and $158,868.20 on other devices.

Figure 12.33 The Acquisition Device report shows revenue generated on the originating device or other devices per device category.
Based on the Device Path and Acquisition Device report, you could potentially allocate additional PPC or other marketing budget to the device category that is performing best for acquisition leading to revenue (on the same device or other devices). If one device category is performing best in Revenue from Other Devices, you can target more of your remarketing to that device category.
Advanced Session Stitching
The session stitching that is enabled by default when we create a User-ID-enabled view ties in hits that were sent to GA before the login occurred in any unauthenticated session. For an advanced technique that allows you to associate entire unauthenticated sessions with authenticated sessions, see “Advanced Session Stitching and Cross Device Attribution using Custom Dimensions in Google Analytics” on the E-Nor blog.
User ID as a Custom Dimension
In addition to passing a user’s unique, anonymous identifier to the GA’s designated userId field for cross-device tracking, pass it also to a Custom Dimension to enable additional analysis. Once you have this identifier captured in a Custom Dimension, you can use it as a secondary dimension, in a custom segment definition, or in a custom report (whether or not you have enabled User ID for cross-device tracking in the view). You could, for instance, view traffic sources or device type for any user ID applied as a custom segment. (This type of analysis by individual ID is generally most useful in conjunction with back-end data also associated with that ID.)
Even more importantly, once populated as a Custom Dimension, the User ID would also be exposed through the API, which means that we could export from GA and integrate with CRM data for long-term lead qualification and customer value analysis as described in Chapter 15. (The designated userId field for cross-device tracking is, in fact, available for export to BigQuery for Analytics 360 users but is not accessible through the API. Even for Analytics 360, it’s recommended to store the User ID variable in a separate Custom Dimension.)
In this way, we can have User ID perform double duty: populated into the designated userId field for cross-device tracking, and populated into a custom dimension (called User ID, Visitor ID, or any meaningful name) for use within the GA user interface and especially as a key for GA/CRM integration.
Even though you must populate User ID for cross-device tracking on a hit-by-hit basis, and only while the user is authenticated, you could opt to configure the User ID custom dimension at user scope for more complete GA data (including unauthenticated sessions following an authentication) for CRM integration.
 Key Takeaways
Custom dimensions help GA speak your language. Custom dimensions allow you to extend the default GA data set and more closely align your reporting with your organization, your offerings, and your users. They’re an important customization for a next-level GA practice.
Content groups are similar to hit-level custom dimensions. Content groups play a similar role for page data as hit-level custom dimensions. The setup process is also very similar, and you can in fact populate a custom dimension and content group with the same data within the same GTM tags.
Take advantage of existing taxonomies. If you have already classified your pages (by author, category, etc.), most of your work is already done. The steps for reading in an existing taxonomy as custom dimensions and/or content groups is quite straightforward, especially if the text already appears in the page text or markup.
Cross-domain tracking is for unified user experiences; roll-up is for integrated reporting. While cross-domain tracking and roll-up reporting both integrate data from multiple websites (or mobile apps in the case of roll-up) into a single property, cross-domain tracking is intended for multiple websites that constitute a unified user experience, while roll-up serves only to integrate reporting for multiple websites (or apps).
You can implement cross-device tracking for logged-in users. By passing a User ID to GA on login, you can populate specialized cross-device reports within a User-ID-enabled view. You can use the same unique but anonymous back-end user identifier to populate the designated User-ID dimension for cross-device reporting and also a visitor ID custom dimension for integrating GA and CRM data, as described in Chapter 15.
 Actions and Exercises
- Assess the need for custom dimensions and/or content groups. If you have an existing taxonomy, or if executives or managers are asking for metrics broken down by dimensions that don’t exist in GA by default, you should probably make custom dimensions and/or content grouping a priority.
- Enable Demographics and Interests. Enable Demographics and Interests, and update your privacy policy as indicated in the chapter (and check with your legal or compliance department beforehand).
- Enable Enhanced Link Attribution. The In-Page Analytics report can be problematic, but it’s still worthwhile to enable Enhanced Link Attribution in the GA pageview in GTM to benefit this report and the Page Analytics plug-in for Chrome.
- Assess the need for cross-domain or roll-up for separate domains. If you need to track several domains, determine if you need to implement cross-domain or roll-up, or if tracking within separate properties is suitable.
- Assess the need for tracking multiple subdomains in a single or separate properties. If you need to track several subdomains, determine if you should track within a single property (as a unified user experience) or if you should track in separate properties. You can also opt to track multiple subdomains into the same property but essentially create a subdomain “roll-up”, similar to a roll-up of separate domains, by specifying a separate cookie domain in the GA tags for each domain.
- Implement cross-device tracking. If your website offers a login, you can implement cross-device tracking as outlined in the chapter.