
10
Segments
At an eMetrics conference back in 2008, the early days of Web analytics, conference chair Jim Sterne asked a panel of industry thought leaders about the number-one thing that analytics platforms are missing.
“Segmentation,” they answered, almost in unison. Some also added that aggregation “stinks” (but used a more colorful term).
Fast forward to today: Web analytics platforms—and Google Analytics (GA) specifically—have done a great job at allowing marketers to slice and dice the data in almost every way possible and to get to insights much more quickly than with the default reporting aggregates.
In this chapter, we cover the power and the ease of segmentation in Google Analytics.
Segment to Focus and Amplify
In analytics, aggregation can hinder insights. When you apply a segment to your GA reports, you’re viewing a cohesive subset of data, based on visitor characteristics or behavior, that will allow you to detect trends that would otherwise remain hidden and to measure and optimize for performance in a more focused and meaningful way (Figure 10.1).

Figure 10.1 Segments focus your analysis on visitor subsets.
If, for example, your boss is still not convinced of the need to invest in a mobile marketing and analytics strategy, you can apply the built-in Mobile Traffic segment to easily isolate mobile visits in Audience Overview, Landing Pages, Source/Medium: the segment stays applied in almost any report you access, so you can readily see if mobile traffic is trending up (while mobile bounce and conversion rates may not be improving). By applying a segment, you’ve gained an insight that you can act upon concretely for business improvement. Your argument is settled, and you can get your mobile budget allocation approved.
Applying a Built-In (“System”) Segment
You can apply two different types of segments to your reports: built-in segments, and custom segments that you or another GA user has defined.
To apply a built-in segment:
- At the top of a GA report, click Add Segment.
- In the left section of the segments panel, click System to display only the system (i.e., built-in) segments as in Figure 10.2.
- Select a segment, such as Mobile Traffic.

Figure 10.2 System (or “built-in”) segments listed in the segment panel.
Once we apply a segment to one report, it stays applied even as we navigate among different reports across properties and accounts. You can apply as many as four segments to a report at one time.
Below we discuss several additional built-in segments.
Non-Bounce Sessions
Why might you want to exclude bounced sessions from your reports? The answer is straightforward: to focus your analysis on visitors who demonstrated an initial level of engagement and therefore better represented your true target audience.
We’re not by any means recommending complacency about your bounce rate. Bounce rate is normally a negative indicator, especially for a transactional website, and you would not want to see your Bounce Rate metric increasing year over year. That said, a certain amount of bounce is always to be expected: such as from errant organic searches, outdated referrals, and so forth. By excluding these sessions from your analysis, you’re tightening the focus to visitors who were, so to speak, really supposed to be on your website to begin with.
With the Non-Bounce Sessions segment applied in Figure 10.3, we amplify the representation of the conversion rate metric and thereby highlight trends more saliently than with only the default All Sessions segment applied. This metric amplification, a key benefit of segments, is explored in greater detail later in the chapter.

Figure 10.3 The conversion rate trend is more pronounced within the Non-Bounce Sessions segment than within All Sessions.
Conversion-Related System Segments
Which pageviews and events occurred most frequently in sessions that included goal completions? Where were the greatest number of exits in non-converting sessions?
Five of the built-in segments relate to goal conversions and Ecommerce transactions:
- Sessions with Conversion
- Sessions with Transaction
- Converters: Similar to Sessions with Conversion, but with the scope set to User instead of Session. (Segment scope is discussed later in the chapter.)
- Made a Purchase: Similar to Sessions with Transaction, but with scope set to User instead of Session.
- Non-Converters: Users who did not complete a goal or an Ecommerce transaction in any session, as defined in Figure 10.4.

Figure 10.4 By making a copy of the built-in Non-Converters segment, we can see that it encompasses users who completed neither a goal nor an Ecommerce transaction.
When you apply the Sessions with Conversion segment to the Pages report, you can see which pages were the most viewed during converting sessions. Similarly, Sessions with Transaction segments for sessions that included an Ecommerce transaction. You can apply the Non-Converters segment at the same time as any of the converter segments to compare pageviews against any of the converter segments. If the top pages in the converter segments are helping, or at least coinciding, with conversions and transactions, you can make these pages even more accessible in your website navigation.
Conversely, the Non-Converters segment mentioned above isolates users who have not converted or transacted in any session, as shown in Figure 10.5. After you apply this segment to the Exit report, how can you improve the top exit pages for non-converters? Better value proposition or call to action?

Figure 10.5 Applying the Non-Converters segment to the Exit Pages report highlights opportunities to optimize the payment and search results pages.
Creating a Custom Segment
As we saw earlier, many of the built-in segments are very useful, but the real power of segments comes with the custom segments that you define yourself. Let’s broadly consider two kinds of segments: we’ll call them characteristic segments and behavior segments.
Characteristic Segments
For characteristic segments, you can very easily define a segment based on a value that you see in the Audience or Acquisition reports, for instance:
- Ontario (province of Canada). Define a segment based on the Region dimension.
- Old versions of Internet Explorer. Define a segment based on Browser and Browser Version dimension.
- Referrals from a partner website. Define a segment based on Source dimension.
All of these examples are based on a dimension value: geography, technology, and traffic source characterize the entire session.
To define a segment for visitors from partnersite.com:
- Access the segment panel shown previously in Figure 10.2.
- Click New Segment.
- At this point, there are two places you can find the dimension to define your segment: in the top five sections of “starter” sections (Demographics through Traffic Sources or Ecommerce), or under Advanced ˃ Conditions. These options are basically equivalent, but we usually recommend to go straight to Advanced ˃ Conditions. There you’ll find all the same dimensions as in the starter sections, and you’ll also be able to select Users or Sessions scope and create a segment based on a custom dimension value, all of which we will discuss below.
- For our example shown in Figure 10.6, we’ll select Source as the dimension, we’ll keep the match drop-down set to contains, and we’ll enter partnersite.com into the value field10.6. Notice that we could also create an inverse segment by selecting Exclude instead of Include from the available drop-down.

Figure 10.6 You can start your segment definition in one of the top sections, such as Traffic Sources, or in Advanced ˃ Conditions, where additional options are available.
Behavioral Segments
Behavioral segments may be a harder to understand at first than characteristic segments, but they can be even more critical for determining your success factors and identifying your different audience constituencies. As a note, the behavioral segments we’re discussing here do not correspond directly with the Behavior section of the new segment panel shown in Figure 10.6.
In a behavioral segment, we’re using a single hit-level action—in most cases, a pageview or an event—to identify entire sessions or even multi-session users.
Let’s say that you run a website that promotes tourism to Denmark. Three months ago, you posted a new page with a prominent link from the home page: “Top 10 Reasons to Visit Denmark This Year.” Your design and content team put considerable effort into this page, and everyone wants to know if it’s helping to increase information requests and mailing list signups.
You create two segments: one that includes sessions in which a Top 10 Reasons pageview occurred as in Figure 10.7, and an inverse session that excludes sessions in which the pageview occurred (in other words, all sessions in which the pageview did not occur).

Figure 10.7 A segment based on the Page dimension includes all data from the sessions in which the page was viewed at least once.
It’s critical to reiterate that a segment defined as Page – exactly matches – /top-10-reasons does not just include that page. If it did, it would serve little purpose, since the Pages report already displays metrics for that page. Instead, this segment identifies all sessions in which this page was viewed at least one time. If you defined a segment as Page – contains – /product, you would not just match pages with /product in request URI; instead, you’d match all sessions that included at least one view of a page with /product in the request URI.
When applied to the Goals reports, our two segments demonstrate a possible correlation between the Top 10 Reasons page and the goal completion: the email signup conversion rate for the Top 10 Viewed segment is 1.45% while only 0.73% for the Top 10 Not Viewed segment, as shown in Figure 10.8.

Figure 10.8 In this example, sessions that included the promo page generated nearly twice the conversion rate of sessions that did not include the promo page.
Is it invalid from a statistical or psychographic standpoint to attribute the increase in conversions to the Top 10 Reasons pageviews? Perhaps: in logical terms, the visitors who were most likely to convert could have also been the most likely to access the Top 10 Reasons page. However, the correlation is very compelling, and we might plausibly attribute the conversion increase, at least in part, to the Top 10 Reasons page, and make an effort to drive more traffic there. At a minimum, we have identified an excellent hypothesis for testing: the Top 10 Reasons to Visit Denmark Page increases our email signups. (We’ll discuss testing techniques in Appendix A.)
To validate that the Top 10 Reasons pageview occurred before the conversion, we can create a segment with a specific step order. Note that you can specify whether or not the steps could have been separated by other interactions; for many types of analysis, direct succession is not as relevant as the completion of the steps in an overall order, so we can keep the default is followed by setting rather than change to is followed immediately by (Figure 10.9).

Figure 10.9 This sequence segment will tell us the number of sessions in which the Top 10 Reasons pageview preceded the email signup.
Based on the success of the Top 10 Reasons page, you decide to invest €10,000 of your marketing budget in a Top 10 Reasons video. How will you measure the video’s effectiveness? Assuming that you have tracked video interactions as GA events, you could again create two segments—sessions with the video play and sessions without the video play—similar to Figure 10.14, and you could again validate the sequence with a Sequence segment similar to Figure 10.9.
Additional Custom Segments
In addition to the segments discussed above, you can define the following segments to focus your analysis.
Sessions with/without Login If your logged-in users are redirected to a page such as /logged-in or /welcome, you can create login and no-login segments based on that page. If your logged-in visitors are not redirected to a special page, you can record a custom dimension (or an event) as part of the login process as described in Chapter 12, “Implementation Customizations,” and then create a segment based on that custom dimension (or event).
High-Value Ecommerce Sessions (or users) with Revenue greater than a specified amount.
Non-Bounce Non-Converting Sessions Copying the built-in Non-Bounce Sessions segment as a basis, we can define a segment that helps us identify pageviews and exit pages for sessions in which the visitor was motivated enough not to bounce but not motivated enough to convert.
Home Page Not Viewed The Landing Pages report immediately indicates the percentage of sessions that did not begin on the home page, but you can also create a segment to display the number of sessions that did not include the home page at all. If a significant portion of your sessions do not pass through the home page at all, you need to make sure that critical messaging and navigation options are not restricted to the home page, since many of your visitors will never see the home page.
Tie Sessions Together with User Scope
When you’re defining a custom segment, the Advanced ˃ Conditions or Sequences options shown in many of the preceding screen shots provide the choice between two scopes: Sessions (the default) and Users. (Note that Scopes does not appear as a label within the user interface.) This distinction may seem trivial, but it’s quite profound, as it allows us to connect actions in one session with outcomes in a later session.
As an example, let’s say that your content team is putting a great deal of time and effort into your blog, and the /blog section of your website is beginning to get organic rankings and trackbacks/pingbacks, but you also want to gauge how much of your blog traffic also reaches the main part of your website.
You decide to create a sequence segment: Landing Page – contains blog, followed by Page – does not contain – blog. If, however, you don’t change the scope from the default of Sessions to Users, you may be missing important insights. With the scope set to User (and Sequence Start set to “First user interaction”) as in Figure 10.12, you can see users who first landed on a blog page but then accessed pages on the main part of your website, even during subsequent sessions.

Figure 10.12 By changing the segment scope from Session to User, we can trace activity on the main part of our website back to landing pages on the blog, even from a previous session.
As another scope example, let’s say that you run a mortgage website. Your primary conversion occurs when your visitor completes an online mortgage application. When you check the Multi-Channel Funnel ˃ Time Lag and Path Length reports, you observe that many conversions are occurring after the first session, as shown in Figure 10.13.

Figure 10.13 This Path Length report demonstrates that many mortgage seekers are converting after the first session.
Your next investigation: which interactions may be helping conversions in later sessions? Is the mortgage calculator on the home page engaging visitors to return and apply for a mortgage? Similarly to the segments we defined earlier in this chapter for individual sessions in which the “Top 10 Reasons to Visit Denmark” promo page was or was not viewed, we can define segments based on mortgage calculator submissions during any of multiple sessions from the same user (assuming that you’re capturing the calculator interactions as GA events or virtual pageviews). See Figures 10.14 and 10.15.

Figure 10.14 This behavioral segment matches any user who submitted a mortgage calculation in any session.

Figure 10.15 Users who submitted a mortgage calculation generated a considerably higher conversion rate.
We could further validate the order of these interactions—that is, that the calculator interactions preceded the goal completions—by creating two sequences at Users scope: one in which the mortgage calculator event did precede the goal completion, and one in which no mortgage calculator event followed the goal completion. When applied to the Audience Overview report, these segments would clearly indicate which came first for most users.
As a note, if the mortgage calculator interaction occurred primarily in the same session as the mortgage application conversion, conversion rate might display lower with a user-scope segment than a session-scope segment. This is due to the fundamental conversion math demonstrated in Figure 8.7: since the denominator in conversion rate is sessions and not users, a user scope segment pulls in more sessions, thereby potentially lowering the conversion rates that the goal or Ecommerce reports display.
User Scope and Cookie Deletion
Keep in mind that the multisession connection of Users scope depends on the _ga cookie. If a visitor to the mortgage site uses the calculator and then returns to the site on a different device or browser or after having deleted cookies, the Mortgage Calculator segment defined above would not be able to recognize any calculator events from previous sessions. (Cross-device tracking, discussed in Chapter 12, can also associate multiple sessions with the same logged-in user.)
Mapping Customer Constituencies as Custom Segments
Two of your top priorities as an analyst and optimizer are to:
- Create GA segments for your different visitor constituencies.
- Perform most of your ongoing analysis within the segments and not within the aggregate data.
What are your customer or visitor constituencies? They’re the designations you already use for your customers or visitors. As a basic example, let’s consider the two basic constituencies on airbnb.com:
- (Potential) hosts: website visitors who want to list a residence as a rental.
- (Potential) renters: website visitors who want to rent out someone else’s residence.
These two different visitor blocs have completely different objectives, so it would make little sense to analyze their behaviors and conversions as one aggregate. But how can you separate these two visitor groups?
In many cases, visitors’ own actions signal the constituencies to which they belong. On airbnb.com, we can define a reasonably accurate potential-host segment based on visitors who click the Become a Host button shown in Figure 10.16 and thereby access the /rooms/new page, as shown in Figure 10.17. To define a segment for your potential renters, change the segment definition in Figure 10.17 from Include to Exclude. In both cases, we can set the scope to Users, also as shown in Figure 10.17.

Figure 10.16 You can identify the constituency of potential hosts on airbnb.com by a clickthrough on Become a Host, which accesses the /rooms/new page.

Figure 10.17 Potential Host segment based on a /rooms/new pageview.
If you’re the person at Airbnb responsible for room listing conversions, the Potential Host segment provides the context that you need. Why should you measure conversion rate against a general audience, most of whom were never potential converters for that goal? With other visitor types excluded from your segment, you’ll get a much clearer indication of your conversion rate in this logical context, and you’ll much more easily be able to detect fluctuations of the amplified conversion rate within a segment than of the nonsegmented conversion rate diluted by traffic that is not relevant for the goal, as you can see in Figure 10.18.

Figure 10.18 Though the number of goal conversions for the List Room goal is the same for all sessions and for potential hosts, the conversion rate for the List Room goal has a much more focused context within the Potential Host segment.1
The Potential Host segment would benefit our analysis within other reports as well. With the Potential Host segment applied, we could access the Channels report to see which traffic channels are sending the most visitors who click Become a Host, or we could view the Goals ˃ Overview report to see if visitors who clicked Become a Host completed other goals besides List Room.
You could also define a Potential Renter segment as the inverse of the Potential Host segment in Figure 10.17: just exclude users who have accessed the /rooms/new page. You could then more meaningfully evaluate your Rent Room goal within the Potential Renter segment, the same way that we evaluated the List Room goal within the Potential Host segment.
As another example, a health insurance website may have five very different types of users, as indicated in Table 10.1.
Table 10.1 Customer Constituencies for a Health Insurer Mapped to Google Analytics Segments
| Constituency | Conversion | Segment Description | Segment Definition |
| Human resource managers or representatives at a client company | Enroll employees: It’s three times as expensive for your insurance company when your client companies enroll a new employee by phone or mail, so your main conversion for HR managers or representatives is to enroll new employees online. | Anyone who enters a human resource login is redirected to the /group-management page on your website, which no other type of user sees. | Page – exactly matches – /group-management |
| Medical provider (doctor, hospital, therapist) | File a claim: Online claims filing is also much more cost-effective than paper or phone claims, so your main conversion for health care providers is to complete a claim filing online. | Anyone who enters a medical provider login is redirected to one of the pages on your website that begin with /provider, which no other type of user sees. | Page – starts with – /provider |
| Existing health insurance policyholders | Watch a video: To encourage policyholders to eat right, exercise, and stay healthy, your main conversion for policyholders is to watch at least 75% of your Fitness Facts video. | In the same scripting that displays a Welcome message when a policyholder logs in, you and your developers can populate a custom dimension named Login Type as policyholder. Since regular policyholders (i.e., not human resource or medical provider) are not redirected to another page, we cannot define this segment based on Page as in the previous two segments. | Custom Dimension Login Type – exactly matches – policyholder (We discuss Custom Dimensions in Chapter 12.) |
| Existing health insurance policyholders—cobranded referrals | Same as above | The insurance company has an agreement with a health care provider for single sign-on (SSO) and cobranding the header (with logos and messaging) when visitors click through from that medical care provider’s website. | Source – contains – medicalprovider.com |
| Individual potential customers | Purchase a policy: Your primary goal for direct consumers is to purchase a health policy. | You can define your potential direct customers as any visitor who does not login and therefore doesn’t match any of the four segments above. | Inverse of the four segments above |
For two of the segments above (human resource and health care provider) all we needed for our segment definition was a page that only that type of visitor can ever access. During the course of a session, all logged-in providers—and only logged-in providers—view at least one page that contains /provider at the beginning of the Request URI. The segment is there waiting to be defined, based on the data that we’re already capturing in GA.
Since existing policyholders are not redirected to a specific page on login, it will take a little more implementation work before we can define our segment. The steps, however, are straightforward: once you have worked with your developers to push a variable named policytype with the value policyholder (just as examples) into the data layer when the policyholder logs in12, we’ll be able to populate the custom dimension in GA and define our segment based on the custom dimension as described in Chapter 12.
It’s not always necessary to identify our constituencies based on behavior or a custom dimensions in the examples above: in the case of the referrals from the medical provider website, medicalprovider.com as a source defines our segment very neatly.
Individual potential customers match none of the criteria of the other four visitor groups, and that’s just how we can define that segment: as the inverse of the other four.
Segment Availability for Other Views and Users
By default, a custom segment that you create in one view is also available to you in any other view. You can opt to restrict the segment to a single view, or to make it visible to other GA users and editable for users with Collaborate rights to the view, as shown in Figure 10.19.

Figure 10.19 Custom segment options.
You can also share segment configurations with other GA users either from the Share Assets screen that you access from the View admin or directly from the segments panel that you access from a report. The procedure for sharing assets is detailed in Chapter 11, “Dashboards, Custom Reports, and Intelligence Alerts.”
By clicking Import from Gallery at the top of the segments panel, you can also import and apply segments that other GA users have contributed to the Solutions Gallery.
Remarketing with Google Analytics Segments
Custom segments can be an extremely useful tool not only for analysis but also for marketing. If, for instance, you create a segment for visitors who view three pages or more but do not convert, you can then use that segment—or audience, as a segment is called for remarketing—to trigger banner displays through the Google AdWords Display Network or the DoubleClick banner platform. You can also take advantage of Remarketing Lists for Search Advertising (RLSA) by using your GA remarketing lists to influence bids, text, and keyword matching through AdWords for searches on Google. We discuss remarketing and RLSA in Chapter 14, “Google Analytics Integrations.”
Multi-Channel Funnel Conversion Segments
The system and custom segments that we’ve examined thus far do not apply to the Multi-Channel Funnel reports discussed in Chapter 7. In these reports, such as Top Conversion Paths below, you can apply built-in or custom segments based on the traffic sources that drove goal or Ecommerce conversions. With the First Interaction Is Paid Advertising conversion segment applied (and the lookback window set to 90 days) in Figure 10.20, we can see that paid advertising served as the first touchpoint for 9.72% of eventual conversions.

Figure 10.20 In the Multi-Channel Funnel reports, you can apply specialized segments based on the traffic sources that generated conversions.
The segment availability settings shown previously in Figure 10.20 do not apply to the Conversion Segments in the Multi-Channel Funnel reports. Any custom Conversion Segment that you define will be accessible to you in other views, properties, and accounts, but not to any other GA user.
Sampling
As useful as segments are, we must remember an important caveat: segmenting your reports can cause sampling. Sampling is triggered when both of the following conditions are in play:
- You are using GA standard, and you’re reporting on a time period that contains more than 500,000 sessions in the view. (At the time of writing, the thresholds in Analytics 360 are 200 million, 50 million if the date selection includes the current day, and 1 million if only the current day is selected. These thresholds are likely to keep increasing or possibly even be removed. For data that is more than 6 months old, the Analytics 360 sampling threshold is reduced to 1 million sessions, but longer lookbacks with the higher thresholds may also roll out in the future.)
- You apply a segment or a secondary dimension to a built-in report, or you access a custom report. (We discuss secondary dimensions in Chapter 2 and custom reports in Chapter 11.)
Segments, secondary dimensions, and custom reports force GA to make on-the-fly calculations. If the sessions in the selected time period surpass the thresholds stated above, these calculations are made only on a subset of the data and then multiplied back out to equal the original number of sessions.
As a simplified example in Figure 10.21, AdWords campaign 2 generated the greatest number of clickthroughs from Malaysia in actuality. When, however, you define a segment for visitors from Malaysia and apply it to your custom report, campaign 1 shows twice as many clickthroughs as campaign 2, because the final data that you see in the reporting interface is based on a disproportionate sample—25% in this case—that was multiplied by four to equal the original number of sessions in the unsampled data.

Figure 10.21 This diagram illustrates how sampling can skew your reporting.
How do we know when sampling is in effect? Let’s say that we wanted to display a list of our best-selling products on tablet devices. Figure 10.22 shows that when we applied the built-in Tablet Traffic segment to the Product Performance report, the sample size has dropped from the unsampled default of 100% to only 5.05% of sessions.
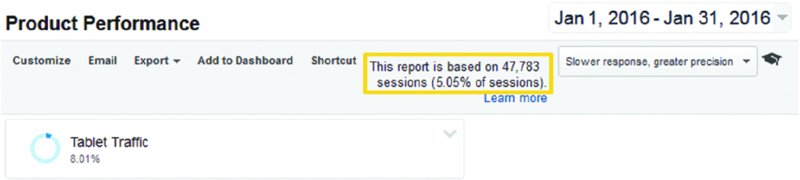
Figure 10.22 When we apply the built-in Tablet Traffic segment, the sample size drops from 100% to 5.05%.
Sample Size and Cardinality
Notice that 5.05% indicates the sample size, not the segment size. The 8.01% segment size in Figure 10.22 is calculated from the 5.05% sample size. Since there are only three device categories—desktop, mobile, and tablet—the Tablet Traffic segment size itself is probably quite accurate based on only 5.05% of data. Where sampling really becomes an issue is when the sampled report involves a data dimension with many possible values—that is, a high-cardinality dimension—or a metric for an infrequent occurrence.
For example, even though the overall 8.01% segment size is reasonably accurate, reporting for hundreds of different products by tablet may be very skewed when based on just 5.05% of actual data. Sampling is especially likely to skew reporting for a high-ticket product that sells infrequently, or for a special goal such as a partnership or sponsorship inquiry that visitors submit only occasionally.
Basically, the smaller the sample size and the more granular or sporadic the data, the more of a problem sampling is going to pose. New versus returning session breakdown based on 60% of your data will be quite accurate, but a 2% sample size can seriously distort the calculation for entrances on 100 different landing pages.
Happily, the GA engineers are making significant improvements in this regard, so sampling is progressively occurring less in GA user interface overall.
If there’s a segment that you use repeatedly, such as all visitors from South America, you can avoid sampling by creating an equivalent filtered view, as discussed in Chapter 9.
Accessing Unsampled Data
If you’re using Analytics 360, you have the option to export an unsampled version of any sampled report as comma- or tab-separated values as shown in Figure 10.23. In approximately one hour, the exported file appears in your Google drive (https://drive.google.com) under the same login that you use for GA.

Figure 10.23 With Analytics 360 you can export unsampled data as comma- or tab-separated values.
For immediate access to unsampled data (when sampling would otherwise occur), you can also preconfigure Custom Tables to avoid sampling for any combination of dimensions, metrics, and segments that falls within the Custom Table definition. Chapter 18 reviews unsampled export and Custom Tables in greater detail. Also refer to the discussions on the Unsampled Request API in Chapter 16.
Segments versus Filtered Views
We previously noted a parallel between segments and the view filters discussed in Chapter 9: both can serve to focus your reporting on a narrower subset of the full data capture. Table 10.2, however, outlines several critical differences.
Table 10.2 Comparison of View Filters and Segments
| View Filters | Segments | |
| Access rights | Edit access required at the view level to create or apply a view filter. | Only Read & Analyze access required to create or apply a segment. |
| Availability/Visibility | View filters affect reporting for anyone who accesses the view. | Default visibility for segments is set to an individual GA user across views. |
| Reports covered | Apply to all data and all reports that you access in the view. | You can apply segments to most reports in the view, but they are not available in the Funnel Visualization or the Multi-Channel Funnel reports. |
| Retroactivity | Apply to your data now forward. | Retroactive. |
| Permanence | Permanently alter underlying report data for the time that they are applied. | Do not alter underlying view data. You can apply and remove them dynamically. |
| Behavior | You can define a filter for all activity within a subdirectory but not for other specific behaviors. | You can define a “behavioral” segment that includes all other hits occurring in the same session that your specified pageview or event occurred in. You can also extend the scope from Sessions to Users. |
| Sampling | Do not cause sampling. | May cause sampling if the sampling conditions described above are met. |
To elaborate on consideration listed in the table, segments provide somewhat more behavioral flexibility than view filters. While view filters allow you to include pageview hits that occur only within a certain subdirectory, segments allow you to include or exclude all hits in a session based on a single specific pageview or event. In cases where your audience constituencies identify themselves by accessing a specific page or generating a specific event, it will be feasible to create a corresponding segment but not a corresponding view filter.
 Key Takeaways
System versus Custom Segments. GA provides a range of built-in (“system”) segments. You can create your own custom segments by copying and modifying a system segment, or you can start from scratch.
Characteristic and Behavioral Segments. You can base your custom segments either directly on a session-level characteristic such as source, technology, or geographic location, or a hit-level behavior such as a pageview or an event that serves to identify the entire session. By applying behavioral segments, you can draw plausible correlations between actions (such as watching a video) and outcomes (such as submitting a lead form) and support them with Sequence segments.
Skip the “starter” conditions. In the New Segment panel, the Conditions selection will provide all of the options available in the “starter” sections, plus some additional options, such as custom dimensions and user scope.
Sequences. As another option for custom segments, you can identify visitors who completed a series of actions within a single session or across multiple sessions.
Retroactive, personal, nonpermanent. Custom segments are analogous to view filters, but custom filters apply retroactively and are available only to you by default, and you can dynamically add and remove segments in your reports without affecting underlying view data.
Focus and amplify. Apply segments to focus your analysis and amplify data points and trends that may otherwise remain undetected in aggregated data.
Map visitor constituencies. If you offer distinct experiences to different types of customers and website visitors, determine the criteria (such as source, pageview, event, or custom dimension) that you can use to map these constituencies as GA segments, and perform much or most of your analysis within these segments.
Aggregates stink. To reiterate and summarize, actionable insights are much more likely to arise from segmentation than from default data aggregation.
 Actions and Exercises
- Review all system segments. Before you define your custom segments, review the built-in system segments. For each of the system segments, analyze at least one report after applying the segment.
- Review the conditions available for a new segment. From the segment panel, click New Segment, review the “starter” conditions (Demographics through Traffic Sources or Ecommerce), and all options available under Conditions.
- Create three custom segments based on session characteristics. Create segments based on source, technology, or geographic data, and apply them to your reports.
- Create two segments based on behavior. Create two segments based on a pageview or an event, and create the inverse of those two segments as well. (For example, sessions in which the visitor viewed the promo page versus session in which the visitor did not view the promo page.) Apply the segments to your reports, especially your goal or Ecommerce reports if either is configured. If you see a possible correlation between the behavior and a goal or Ecommerce conversion, create a corresponding Sequence segment to validate that the pageview preceded the goal completion or Ecommerce transaction.
- Change the scope of your behavioral segments to Users. How does user scope affect the metrics displayed in your goal and Ecommerce reports? Keep in mind, as discussed in the chapter, that conversion rate can actually appear lower if most conversions occurred in the same sessions as the behavior (such as a video play or a pageview of a specific page), but the conversion rate will appear higher if most conversions for the users occurred in different sessions from the behavior in the segment definition.
- Create segments for each of your visitor or customer constituencies. Determine the criteria that you can use to create segments for each of your customer or visitor groups. If you’re unsure of which groups you need to account for, speak with your colleagues, managers, and executives.
- Begin generating any custom dimension (or event) data needed for your segments. If you need custom dimension data to base a segment on—for example, logged-in users who aren’t redirected to a designated page and cannot therefore be segmented by a Page dimension value—work with your development team to code the custom dimension, and then define the segment. If you need event or virtual pageview data for a behavioral segment—for example, a session in which a video was completed or a PDF was downloaded—configure the event or virtual pageview as a priority, and then define the segment.