
Lissajous Figures
Another scientist who transformed sound into visual patterns was Jules Antoine Lissajous (1822–1880). Lissajous was professor of mathematics at the Lyceé Saint-Louis in Paris, where he studied all kinds of vibrations and waves. In 1855 he invented a simple optical device for analyzing compound vibrations. He attached small mirrors to the prongs of two tuning forks vibrating at right angles to each other. When a beam of light was aimed at one of the mirrors, it bounced off to the other mirror and from there to a screen, where it formed a two-dimensional pattern, the result of superimposing the two vibrations. This simple device—a forerunner of the modern oscilloscope—was a novelty in his time; up until then the study of sound depended entirely on the process of hearing, that is, on the human ear. Lissajous literally made it possible to “see sound.”
Just as with snowflakes, Lissajous figures, as they came to be known, come in an infinite variety. Any change in the parameters of the two vibrations will drastically affect the ensuing figure. To see this, let
![]()
where a and b are the amplitudes of the two vibrations, ω1 and ω2 are their angular frequencies (in radians per second), and φ is the phase difference between them. As time progresses, a point P whose coordinates are (x, y) will describe a curve whose equation can be obtained by eliminating t between the two preceding equations. For example, if ω1 = ω2 and φ = 0 (the two vibrations being in tune and in phase), we get y = (b/a)x, the equation of a straight line through the origin; if, however, φ = π/2 (a 90° phase difference), we get x2/a2 + y2/b2 = 1, an ellipse.1 If the phase difference slowly grows with time, this ellipse will continuously change its orientation and shape, passing (in the case a = b) from the circle x2 + y2 = 1 to the pair of lines y = ± x. When the frequencies are unequal, the resulting figure becomes much more complex; if the ratio ω1/ω2 is an irrational number, the figure will never close—it will be aperiodic.
Due to their great variety, Lissajous figures became a favorite of nineteenth-century popular-science demonstrations. Their greatest expositor was none other than Lissajous himself, who—just like his predecessor, Chladni—made the lecture circuit all across Europe. And like Chladni, among Lissajous’s audience was a distinguished guest—Emperor Napoleon, this time Napoleon III. Lissajous’s experiments were shown at the Paris Universal Exposition in 1867, in recognition of which he was awarded the prestigious Lacaze Prize in 1873.
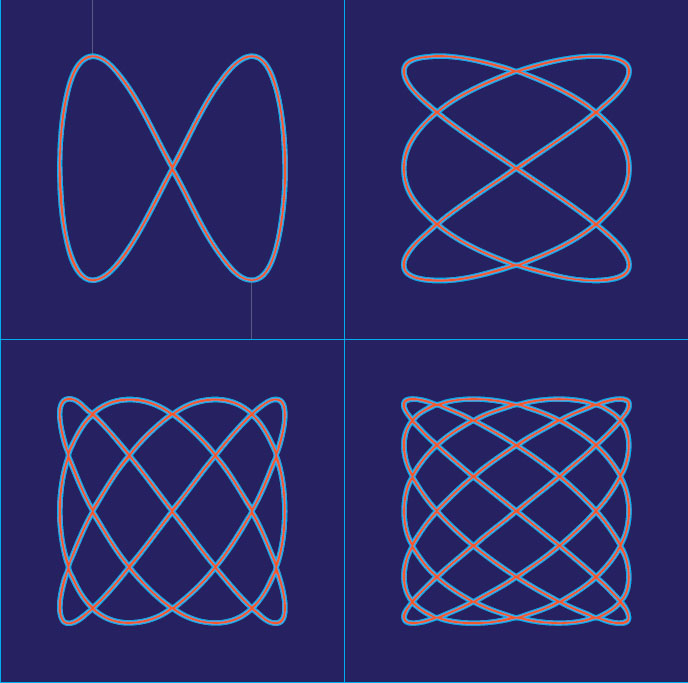
Our illustration (plate 43) shows four Lissajous figures with (going clockwise) frequency ratios of 1:2, 2:3, 3:4, and 4:5 and equal amplitudes. With graphing software you can create a virtually infinite variety of these figures, with arbitrary amplitudes, frequency ratios, and phase differences. It is fascinating to watch how even a small change in any of these parameters—and especially the frequency ratio—can drastically alter the ensuing figure. In years past, these figures were generated mechanically with a harmonograph—a device consisting of two coupled pendulums oscillating at right angles to each other; the frequencies could be varied by adjusting the length of each pendulum. You can still see a harmonograph at work at a few science museums, but the digital age has made it obsolete.
NOTE:
1. To see this, write x = a sin ω1t, y = b sin (ω1t + π/2) = b cos ω1t. Dividing the first equation by a and the second by b, squaring, and adding, we get x2/a2 + y2/b2 = 1.