
CHAPTER 16
What are logical data models?
What does business need?
Forget the technology
Enter logical
The highlighted row in Table 16.1 shows the focus of this chapter, which is the logical data model.
Table 16.1 The Logical Data Model is the focus of this chapter
| Relational | Dimensional |
Subject Area Model (SAM) | ‘One-pager’ on how something works | ‘One-pager’ on what is monitored |
Logical Data Model | Detailed business solution on how something works | Detailed business solution on what is monitored |
Physical Data Model | Detailed technical solution on how something works | Detailed technical solution on what is monitored |
A logical data model (LDM) takes the business need defined on a subject area model down to the next level of a business solution. That is, once you understand at a broad level the scope of an effort and what business people require to solve their problem, the next step is to come up with a solution for them in the form of a LDM. The logical data model is explained, along with a comparison of relational and dimensional mindsets. Then, for relational models, the techniques of normalization and abstraction are discussed. Then we answer Frequently Asked Questions (FAQ) on dimensional modeling, which leads to explaining terms such as conformed dimensions and factless facts. We conclude by explaining how Logical Data Models are supported by Power Designer, and use four exercises to reinforce the lessons for you.
Logical Data Model Explained
A logical data model (LDM) is a business solution to a business problem. It is how the modeler captures the business requirements without complicating the model with implementation concerns such as software and hardware.
On the subject area model, we might learn, for example, what the terms, business rules, and scope would be for a new order entry system. After understanding the requirements for the order entry system, we create a LDM containing all of the data elements and business rules needed to deliver the business solution system. For example, the subject area model will show that a Customer places many Orders. The LDM will capture all of the details behind Customer and Order, such as the customer’s name, their address, the order number, and what is being ordered. While building the LDM, questions or issues may arise having to do with specific hardware or software such as:
· How can we retrieve this information in less than 5 seconds?
· How can we make this information secure?
· There is a lot of information here. What is the best way to manage storage space?
These questions focus on hardware and software. Although they need to be documented, they are not addressed in a data modeling tool until we are ready to start the physical data model. The reason these questions depend on technology is because if hardware and software were infinitely efficient and secure, these questions would never be raised.
Comparison of Relational with Dimensional Logical Models
There are both relational and dimensional logical data models. Relational modeling is the process of capturing how the business works, while dimensional modeling is the process of capturing the information the business needs to monitor how well it is doing. Relational modeling captures how the business works and contains business rules, such as “A Customer must have at least one Account”, or “A Product must have a Product Short Name.” Dimensional modeling focuses on capturing and aggregating the metrics from daily operations that enable the business to evaluate how well it is doing by manipulating the numbers. For example, examining the measure Gross Sales Value Amount at a day level and then, after getting the answer, looking at Gross Sales Value Amount at a month or year level, or at a product or brand level, or a city or country level. The dimensional model is all about playing with numbers. Recall the Ice Cream CSAM from Figure 15.6, a subset of which appears in Figure 16.1.
Figure 16.1 Ice cream CSAM subset
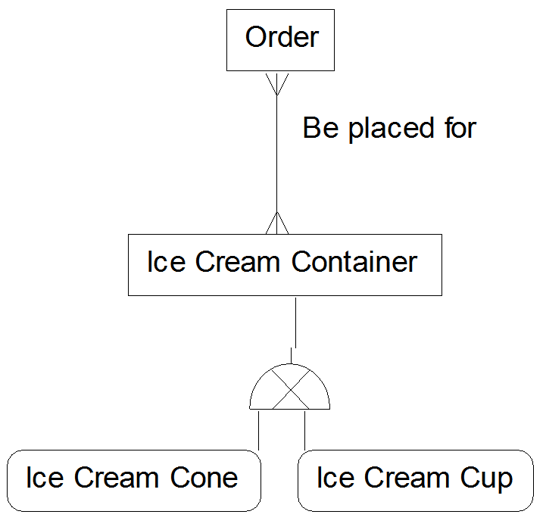
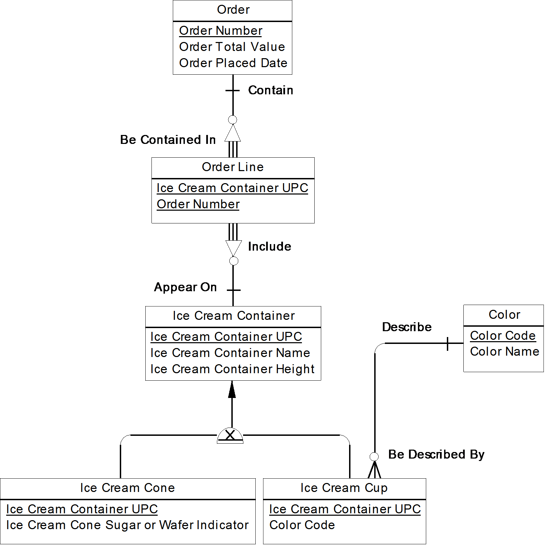
Figure 16.2 contains the relational logical data model for this CSAM.
Figure 16.2 Ice cream relational logical data model
Data element definitions:
Color Code | The short name of one of the primary colors, such as ‘b’ for ‘blue’. |
Color Name | The full name of one of the primary colors, such as ‘blue’, ‘red’, or ‘yellow’. |
Ice Cream Cone Sugar Or Wafer Indicator | Determines whether the ice cream cone is made of a sugar-based or wafer-based material. Contains either the value ‘S’ for ‘Sugar’ or ‘W’ for ‘Wafer’. |
Ice Cream Container Height | The height, in inches, of the container. Used by inventory to determine how many containers can fit on a storage shelf. |
Ice Cream Container Name | The name our store employees use for communicating with consumers on what they would like to order. Examples range from the smallest, called “Kid’s Cup”, to the largest size, called “Kitchen Sink”. |
Ice Cream Container UPC | UPC (Universal Product Code) is a numeric code used to identify a specific product across the ice cream industry. |
Order Total Value | The total dollar amount of the order, including sales tax. |
Order Placed Date | The date the order was placed. |
Order Number | The unique number assigned to each order placed by a consumer. It is a numeric sequence number that never repeats. |
Business Rules (listed in the order we would typically walk someone through the model):
· Each Order may contain one or many Order Lines.
· Each Order Line must be contained in one Order.
· Each Ice Cream Container may appear on one or many Order Lines.
· Each Order Line must include one Ice Cream Container.
· Each Ice Cream Container must be either an Ice Cream Cone or an Ice Cream Cup.
· Each Ice Cream Cone is an Ice Cream Container.
· Each Ice Cream Cup is an Ice Cream Container.
· Each Color may describe one or many Ice Cream Cups.
· Each Ice Cream Cup must be described by one Color.
A relational logical data model captures the business solution for how part of the business works. On this ice cream relational logical data model, we are representing the properties and rules for part of an ice cream ordering system, including Order, Order Line, and Ice Cream Container. Our solution, for example, allows us to capture whether an ice cream cone is a sugar or wafer cone, but does not allow us to capture the color of the ice cream cone. We can only capture the color for cups, not cones.
Two additional notes on the model in Figure 16.2:
· The primary key for a subtype must have the same primary key as its supertype. Given “Each Ice Cream Cone is an Ice Cream Container” and “Each Ice Cream Cup is an Ice Cream Container”, it makes sense for an Ice Cream Cone to have the same primary key as an Ice Cream Container, and an Ice Cream Cup to have the same primary key as an Ice Cream Container.
· There are more details on the logical data model. Whereas the subject area model contained a many-to-many relationship between Order and Ice Cream Container, the logical model contains more details, including the new entity Order Line, which resolves the many-to-many relationship between Order and Ice Cream Container. Also, the Color logical entity was not considered basic and critical and therefore did not need to be shown on the subject area model. In fact, it is not uncommon to have ten or more logical entities capture the details behind one subject area.
A dimensional logical data model captures all of the information needed to answer business questions where the answers to the questions are measures, and these measures need to be reported at different levels of granularity. Granularity means the level of detail of the measures, such as by a particular level of calendar including day, month, or year, or by a particular level of geography, including city, region, or country. Here are some examples of business questions that focus on measures:
· What is my Gross Sales Value Amount by Region, Product, and Month? Now what about by Region and Year? How about by Product Brand and Quarter?
· How many Students majored in Computer Science this Semester? How about for the whole Year?
· What is our Member Growth Rate by Region over the last five Years? How about by Country over the last ten Years?
Figure 16.3 contains the dimensional logical data model that is based on the ice cream example from Figure 16.1.
Figure 16.3 Ice cream dimensional logical data model

Sales Value Amount is captured at the Date and Ice Cream Container level and then the user (or reporting tool) can navigate and look at Sales Value Amount at different levels of detail. “What was the value of our Sales of Sugar Ice Cream Cones in August 2011? Oh, that number is so low. What was the value of our Sales of Sugar Ice Cream Cones each date in August 2011? Or how about the value of Sales for all of 2011 for all Ice Cream Containers?” These are examples of some of the questions that can be answered. Note that all of these questions focus on measures - in this case, Sales Value Amount.
Although the symbols are very similar across both the relational model in Figure 16.2 and the dimensional model in Figure 16.3, the modeling mindset required is very different. With the relational model, we ask “How does this business work?” With the dimensional model, we ask “What does the business want to monitor?” On a relational model, we have the building blocks of entity, data element, and relationship. On a dimensional model, we have similar symbols, but they represent different concepts:
· Measure. A data element that may be manipulated in or is the result of a calculation (e.g., sum, count, average, minimum, maximum). Sales Value Amount is an example of a measure in our ice cream example.
· Meter. A meter is an entity containing a related set of measures. It is not a person, place, event, or thing, as we find on the relational model. Instead, it is a bucket of common measures. As a group, common measures address a business concern, such as Profitability, Employee Satisfaction, or Sales. The meter is so important to the dimensional model that the name of the meter is often the name of the application.
· Grain. The grain is the meter’s lowest level of detail. It should be low enough that the answers to all of the business questions within the scope of the dimensional model are derivable. It is generally a good practice to define the measures and grain as early as possible in the requirements process. The grain in our ice cream example is Ice Cream Container and Date.
· Dimension. A dimension is reference information whose purpose is to add meaning to the measures. All the different ways of filtering, sorting, and summing measures make use of dimensions. Dimensions are often, but not exclusively, hierarchies. A hierarchy is when a higher level breaks down into many lower levels, but a lower level rolls up into only one higher level. Our calendar structure in Figure 16.3 is an example of a hierarchy, because every Date rolls up into a single Month, and every Month rolls up into a single Year. Also, every Year contains many Months and every Month contains many Dates. Ice Cream Container is an example of a dimension that is not a hierarchy.
· Dimensional level. A dimensional level is one level within the hierarchy of a dimension, such as Month within the Calendar dimension. Dimensional levels are used to facilitate calculating measures at the level(s) the business needs to see. They are not built based on how the business works.
· Dimensional attribute. The properties within a dimension, such as Ice Cream Container Height, in the Ice Cream Container dimension.
We’ve emphasized several times that relational modeling captures how something works and dimensional captures what is being monitored. Let’s look at this distinction in another way - there are three main differences between relational and dimensional models: focus, lines, and scope:
· Focus. A dimensional model is a data model whose only purpose is to allow efficient and user-friendly filtering, sorting, and summing of measures. A relational model, on the other hand, focuses on supporting a business process. Dimensional models are appropriate when there is a need to massage numbers, such as by summing or averaging. The reason the dimensional model should be limited to numbers is because its design allows for easy navigation up and down hierarchy levels. When traversing hierarchy levels, measures may need to be recalculated for the hierarchy level. For example, a Gross Sales Value Amount of $5 on a particular date might be $100 for the month in which that date belongs.
· Lines. The relationship lines on a dimensional model represent navigation paths instead of business rules, as in a relational model. Let creativity drive your dimensional structures. The relationships in a dimensional hierarchy do not have to mimic their relational counterparts. You should build dimensions to meet the way the business users think.
· Scope. The scope of a dimensional model is a collection of related measures that together address a business concern, whereas in a relational model, the scope may be a broad business process, such as order processing or account management. For example, the metrics Number of Product Complaints and Number of Product Inquiries can be used to gauge product satisfaction.
Normalization Explained
When I turned 12, I received a trunk full of baseball cards as a birthday present from my parents. I was delighted, not just because there may have been a Hank Aaron or Pete Rose buried somewhere in that trunk, but because I loved to organize the cards. I categorized each card according to year and team. Organizing the cards in this way gave me a deep understanding of the players and their teams. To this day, I can answer many baseball card trivia questions.
Normalization, in general, is the process of applying a set of rules with the goal of organizing something. I was normalizing the baseball cards according to year and team. We can also apply a set of rules and normalize the data elements within our organizations. The rules are based on how the business works, which is why normalization is the primary technique used in building the relational logical data model.
Just as those baseball cards lay unsorted in that trunk, our companies have huge numbers of data elements spread throughout departments and applications. The rules applied to normalizing the baseball cards entailed first sorting by year, and then by team within a year. The rules for normalizing our data elements can be boiled down to a single sentence:
Make sure every data element is single-valued and provides a fact completely and only about its primary key.
The underlined terms require more of an explanation.
‘Single-valued’ means a data element must contain only one piece of information. If Consumer Name contains Consumer First Name and Consumer Last Name, for example, we must split Consumer Name into two data elements - Consumer First Name and Consumer Last Name.
‘Provides a fact’ means that a given primary key value will always return no more than one of every data element that is identified by this key. If a Customer Identifier value of ‘123’ for example, returns three customer last names (‘Smith’, ‘Jones’, and ‘Roberts’), it violates this part of the normalization definition.
‘Completely’ means that the minimal set of data elements that uniquely identify an instance of the entity is present in the primary key. If, for example, there are two data elements in an entity’s primary key, but only one is needed for uniqueness, the data element that is not needed for uniqueness should be removed from the primary key.
‘Only’ means that each data element must provide a fact about the primary key and nothing else. That is, there can be no hidden dependencies. For example, assume an Order is identified by an Order Number. Within Order, there are many data elements, including Order Scheduled Delivery Date, Order Actual Delivery Date, and Order On Time Indicator. Order On Time Indicator contains either a ‘Yes’ or a ‘No’, providing a fact about whether the Order Actual Delivery Date is less than or equal to the Order Scheduled Delivery Date. Order On Time Indicator, therefore, provides a fact about Order Actual Delivery Date and Order Scheduled Delivery Date, not directly about Order Number, so it should be removed from the normalized model. Order On Time Indicator is an example of a derived data element, meaning it is calculated. Derived data elements are removed from a normalized model.
 You can record Order On Time Indicator in PowerDesigner as a Data Item in a Data Dictionary model, a Term in the Glossary, or as a Business Rule. All of these can be linked to the attributes from which the indicator setting is derived.
So, a general definition for normalization is that it is a series of rules for organizing something. The series of rules can be summarized as: Every data element is single-valued and provides a fact completely and only about its primary key. An informal definition I frequently use for normalizing is: A formal process of asking business questions. We cannot determine if every data element is single-valued and provides a fact completely and only about its primary key unless we understand the data. To understand the data, we usually need to ask lots of questions. Even for an apparently simple data element such as Phone Number, for example, we can ask many questions:
· Whose phone number is this?
· Do you always have to have a phone number?
· Can you have more than one phone number?
· Do you ever recognize the area code as separate from the rest of the phone number?
· Do you ever need to see phone numbers outside a given country?
· What type of phone number is this? That is, is it a fax number, mobile number, etc.?
· Does the time of day matter? For example, do we need to distinguish between the phone number to use during working hours, and outside working hours? Of course, that would lead to a discussion on what we mean by ‘working hours’.
The answers to questions like these do not have to result in new attributes or changes to attributes. They could lead to the addition of Data Items, Business Rules, or Terms in the Glossary, which you then link to the relevant attributes or entities.
To ensure that every data element is single-valued and provides a fact completely and only about its primary key, we apply a series of rules or small steps, where each step (or level of normalization) checks something that moves us towards our goal. Most data professionals would agree that the full set of normalization levels is the following:
· first normal form (1NF)
· second normal form (2NF)
· third normal form (3NF)
· Boyce/Codd normal form (BCNF)
· fourth normal form (4NF)
· fifth normal form (5NF).
Each level of normalization includes the lower levels of rules that precede it. If a model is in 5NF, it is also in 4NF, BCNF, and so on. Even though there are higher levels of normalization than 3NF, many interpret the term “normalized” to mean 3NF. This is because the higher levels of normalization (that is, BCNF, 4NF, and 5NF) cover specific situations that occur much less frequently than the first three levels. Therefore, to keep things simple, this chapter focuses only on first through third normal forms.
Normalization provides a number of important benefits: (NOTE: In this section, the term data model may also represent the physical database that will be implemented from the data model)
· Stronger understanding of the business.
· Greater application stability.
· Less data redundancy.
· Better data quality.
· Faster building of new models.
Initial Chaos
We have all put together puzzles at one time or another. After you open the box and dump out the pieces, the sight can be overwhelming: hundreds, maybe thousands, of tiny pieces in a large pile. The pile is in a state of chaos. As we pick each piece up and examine it, we understand its properties in the form of its shape. We lack knowledge at this point about how these puzzle pieces connect with each other. We begin the process of fitting the pieces together and, after much effort, we complete our masterpiece. Each puzzle piece is in its proper place.
The term chaos can be applied to any unorganized pile, including data elements. We may have a strong understanding of each of the data elements, such as their name and definition, but we lack knowledge about how the data elements fit together. We understand each piece of the puzzle, but we do not yet understand the connections between the pieces. In our business card example, we do not know the relationship between Mailing Address and Phone Number before normalizing. Just as we need to determine the appropriate place for each piece within our puzzle, we need to determine the appropriate place for each data element within our model.
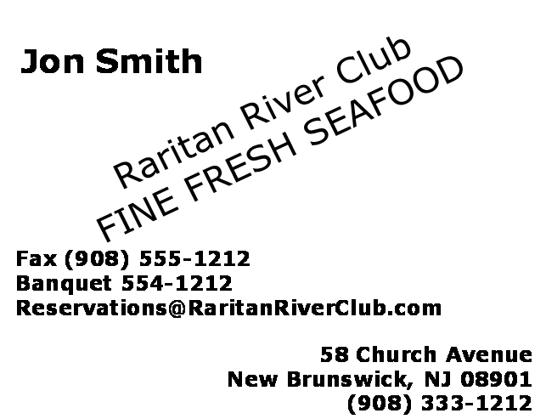
Recall our four business cards from Figure 1.2, repeated here as Figure 16.4.
Figure 16.4 Four business cards from my nightstand
|
|
| |
|
|
| |
|
|
| |


In this business card example, chaos starts off as one pile of data elements. In other words, all the data elements can be initially assigned to one entity, the business card itself. See Figure 16.5.
Figure 16.5 Initial set of data elements in chaotic state

As was noted earlier, it is sometimes easier to think of an entity as a set of spreadsheet columns. Each data element in the entity is a separate column, and the rows in the spreadsheet represent the entity instances. Table 16.2 is a spreadsheet showing the data elements from Figure 16.5 as columns and the four business cards from Figure 16.4 as rows.
Table 16.2 Four sample business cards in spreadsheet format
Card | Person Name | Person Title | Company Name | Web Address | Email Address | Mailing Address | Phone Number | Logo Image | Specialty Description |
1 | Steve Hober-man | Presi-dent | Steve Hoberman & Associates, LLC | www. steve hober-man. com | me@steve-hoberman. com | 10 Main St New York, NY 10021 | 212-555-1212 | Entity Model. jpg |
|
2 | Steve Jenn |
| findsonline.com | finds-online. com |
| (973)555-1212 |
| Internet auction experts
| |
3 | Bill Smith |
| The Amazing Rolando |
| BillSmith@TheAmaz-ingRolando.com |
| 732-555-1212 |
| Magic for all occasions Walk around magic Children’s parties |
4 | Jon Smith |
| Raritan River Club |
| Reservations@Raritan-RiverClub.com | 58 Church Avenue New Bruns-wick, NJ 08901 | (908)333-1212 (908)555-1212 554-1212 |
| Fine fresh seafood |
We hit a very interesting data modeling challenge in this step. It is a challenge that many of us face on the job when we first start a modeling project. The challenge is whether to model the medium or the content of the medium. In other words, do we model the form, report, or in this case business card? Or do we model the contents of the form, report, or business card?
In one of my data modeling classes, the students need to model a survey form. Some model the form itself, with a prominent entity in the center called Survey and supporting entities surrounding it. Others model the content of the survey, modeling the questions and creating data elements for the responses.
We need to ask a basic question to know whether we need to model the medium or the contents of the medium: Why are we building this data model? If we are building it for a business card company to automate the process of printing business cards, then the business card entity is appropriate. If we are building it for an organization or person to manage their contact information, then the business card is no longer the important concept. Rather, the contents of the business card are important and the business card serves as a grouping mechanism or source for our information.
To make the business card exercise even more fun, let’s assume we are modeling this for a contact management organization, and the model you build will be the foundation for a new contact management application. In other words, we will model the content instead of the medium. Therefore, let’s update the model as shown in Figure 16.6.
Figure 16.6 Contact management data elements in chaotic state

Normalizing is a process of asking questions. After asking the key question on model purpose, we now have another important question: What is a Contact? This is where we realize how important definitions are to the analysis and modeling process. Contact can mean different things to different people or departments, much the same way as Customer can mean different things to different people or departments. Is Contact the person in an organization whose phone number and email address we would like to capture? Is it the organization’s phone number and email address itself? Or is Contact the person’s phone number or email address, and the person or organization becomes the contactee?
After hours of talking to people in different departments in the organization building this contact management application, we have come up with this definition of Contact:
A person, a company, or a person at a company who our organization cares about knowing how to reach.
Now that we know what a Contact is, how would a businessperson request a specific Contact? We need to ask how a Contact is identified. We need something that, at least initially, makes a contact unique. If we are replacing an existing contact management system, we can investigate what makes a contact unique in that system and use the same primary key here. If this is a new contact management system, we need to interview business people and consult requirements documents to determine what data element or data elements can uniquely identify a contact.
Let’s assume that this is for a new system and the manager of the department building the system would like the system to create a new unique identifier for each Contact. The manager would like this Contact Id combined with the Contact’s email address to guarantee uniqueness. See Figure 16.7 for the Contact model with this new primary key added.
In normalizing, you have to ask a business expert many questions or examine a lot of actual data to answer the questions themselves. Table 16.3 shows the same data from Table 16.2 with the rows divided to show the impact of defining a contact by Contact Id and Email Address. Note that a business card can have more than one contact. Note also that Contact Id is just a meaningless number, and therefore the values do not have to be a sequential counter.
Figure 16.7 Contact entity with primary key

Table 16.3 Four sample business cards in spreadsheet format segmented by Contact
Card | Con-tact Id | Email Address | Person Name | Person Title | Company Name | Web Address | Mailing Address | Phone Num-ber | Logo Image | Specialty Descrip-tion |
1 | 123 | me@ steveho-berman.com | Steve Hober-man | Presi-dent | Steve Hoberman & Associates, LLC | www. steve hober-man. com | 10 Main St New York, NY 10021 | 212-555-1212 | Entity Model. jpg |
|
2 | 54 | Steve@ finds-online.com | Steve |
| finds online. com | finds-online. com |
| (973) 555-1212 |
| Internet auction experts |
| 58 | Jenn@ finds-online.com | Jenn |
| finds online.com | finds-online. com |
| (973) 555-1212 |
| Internet auction experts |
3 | 42 | Bill Smith@ The-AmazingRolando.com | Bill Smith |
| The Amazing Rolando |
|
| 732-555-1212 |
| Magic for all occasions Walk around magic Children’s parties |
4 | 14 | Reser-vations@RaritanRiver-Club.com | Jon Smith |
| Raritan River Club |
| 58 Church Avenue New Bruns-wick, NJ 08901 | (908) 333-1212 (908) 555-1212 554-1212 |
| Fine fresh seafood |