YOUR TURN TO PLAY
The relationships don’t have meaningful names yet, so change the names to those shown in Table 13.3, and add the role names shown in the table. The quickest place to change the names is in the list of relationships. If you customize the list of relationships again, you can also display the role names.
Table 13.3 New relationship names and role names
Entity 1 | Entity 2 | Original Name | New Name | Entity 1 > Entity 2 role name | Entity 1 > Entity 2 role name |
A | B | Relationship_1 | owns | own | be owned by |
B | C | Relationship_2 | contains | contain | be within |
A | C | Relationship_3 | apply for | apply for | be applied for by |
C | D | Relationship_4 | request | request | be requested by |
The second role names have been padded out with ‘be’ and ‘by’ to improve the assertion statements. For example:
Each C may request one or more D.
Each D must be requested by one and only one C.
 The list of relationships is sorted by the relationship name; when you open the list after changing the relationship names, they will, of course, be in a different sequence.
An Entity’s Relationships
On the property sheet for an entity, there is no ‘Relationships’ tab; relationships are just one example of the dependencies an entity may have, so they have a sub-tab on the ‘Dependencies’ tab. If you prefer to have a separate tab for relationships, you can create one via a model extension. The ‘Dependencies’ tab is shown in Figure 13.10; remember that you can open the property sheet for a relationship by double-clicking the relationship name in the list.
Figure 13.10 Entity ‘Dependencies’ tab

YOUR TURN TO PLAY
Open the ‘Dependencies’ tab on the property sheet for entity C. The ‘Relationships’ sub-tab shows three relationships. Double-click any relationship name to open its property sheet. Now click on both of the ‘Entity 1’ and ‘Entity 2’ buttons at the very top of the relationship property sheet. The property sheets for the entities will open (actually, one of them was already open), so now you have three separate property sheets open.
Display Preferences for Relationships
The Display Preferences give you control over the appearance of relationships on a diagram. Look at Figure 13.11 for an example of a relationship that is displaying the role names and cardinalities. Note also the curved right-angled corner on the relationship line.
Figure 13.11 Relationship with role names and cardinalities

Did you notice that the relationship role names in Figure 13.11 do not use the same verb? In most relationships, you would use the same verb for both role names, but that is not compulsory. Use the verbs that provide the most meaning for each direction of the relationship.
Figure 13.12 shows the Display Preferences for the relationships in Figure 13.11. This works in the same way as the display preferences for entities, except for the split between the source, center, and destination part of the line. As with entities, you can choose which diagrams to apply a style to, and set a default style.
Figure 13.12 Relationship display preferences

Figure 13.3 shows the Symbol Format options for the Relationships, which you can access from Figure 13.2 by selecting the ‘Format’ tab, then clicking on <Modify>. The format options are similar to those for entities, though there are fewer tabs, and additional options for the line style.
Figure 13.13 Relationship symbol format options

Figure 13.14 shows some of the style options available. You can override the notation style for lines, and choose to use dashed lines instead, and you can choose between four corner styles. For an individual relationship, you can choose between a large number of arrowheads for each end, but we wouldn’t recommend that, except when presenting a simplified data model[9] using a specially-constructed diagram. In general, you should use the line style that comes with the notation you’re using.
Figure 13.14 Relationship style options
Line Style
| Corner Style
|


Figure 13.15 illustrates the different corner styles that are available to you, in the order presented above.
Figure 13.15 Corner Styles illustrated

YOUR TURN TO PLAY
During analysis, we discover that there is a maximum 6 instances of D in the request relationship. Open the properties for the relationship.
1. Change the cardinalities of ‘C to D’ from ‘0,n’ to ‘0,6’ – simply replace the ‘n’ with ‘6’.
2. Now change the Display Preferences to show more information – display both role names and both cardinalities. Remember to apply it to ‘all symbols’. The resulting diagram should look like Figure 13.16.
Okay, the diagram is messy, but you can see that PowerDesigner places the role names and cardinalities at the appropriate end of the relationship, and in such a position that they can be read in a clockwise fashion.
Figure 13.16 More relationship properties displayed

Routing Relationships
PowerDesigner allows you to take complete control of the routing of your relationships, and also offers to manage the routing for you. To allow PowerDesigner to route your lines, ensure that your default corner style has right-angled corners, and select ‘Automatic Link Routing’ in the Display Preferences. It is also useful to select ‘Show bridges at intersections’, as well.
See “Routing Link Objects” in Chapter 10, to remind yourself of the capabilities.
YOUR TURN TO PLAY
It’s time to reformat and straighten our relationship lines, without dragging anything around.
1. Select all symbols on the diagram (I use <Ctrl+A>), and right-click on one of the relationship lines. If the contextual menu that appears does not have the Reroute link option at the top, then you missed the target, and right-clicked on something else, instead. Once you have the correct menu displayed, select Reroute link.
Nothing happened, did it?
PowerDesigner will only automatically route relationships for you if the corner style has right-angled corners, and yours are all ‘freestyle’. Via Display Preferences, change the corner style to ‘rounded right angles’  , and apply this to all symbols.
When you change the corner style this way, PowerDesigner automatically reroutes the links for you, but they can still be improved. The easiest fixes to apply are the horizontal and vertical alignments – select all symbols, then press <Ctrl+H>, followed by <Ctrl+L> - the sequence doesn’t matter, as relationships would only be affected by one or the other, not both. You should see some improvements, but that long, winding relationship from B to C will not have changed, so we have to give that one special treatment.
2. Right-click the relationship from B to C, and select Arrange Connectors from the Disposition options. The line will now be shortened, but will probably (it does on my diagram) overlap the relationship from C to D. Undo the last change, to revert back to the long, winding line.
3. It’s time to let PowerDesigner take control of routing – in Display Preferences, enable ‘Automatic Link Routing’. Now select the B to C relationship, and run ‘Arrange Connectors’ again. The line will be rerouted differently from before, and other lines have probably been moved slightly to make room for it. Any additional minor adjustments will have to be made manually.
4. Your relationships will probably look clearer if your entities are better aligned – try to re-create the layout shown in Figure 13.17. First, use the mouse to drag the entities into approximately the right positions. Second, select vertical or horizontal groups of entities, and use the tools  on the layout toolbar or the symbol menu to align them.
 You can achieve a neater result when centering symbols if you select relationships, as well as entities. For example, use the mouse to roughly line up entities A, C, and D vertically, and then use a selection box to select all three entities and their connecting relationships. Right-click any selected symbol to open a contextual menu, and select Center on Horizontal Axis from the Align menu (or press <Ctrl+H>). Ensure that all the symbols remain selected, re-open the contextual menu, and select Evenly Space Vertically from the Align menu (or press <Ctrl+L>).
As well as using the mouse, you can use the keyboard arrow keys to move selected symbols. As you move entities, the relationships are continually re-drawn. For final adjustments, drag segments of relationships sideways, or drag relationships sideways by their end handles. You can also drag the relationship names and role names around if they get in each other’s way. You may need to drag the owns relationship to a different location (I had to) – use the corner handle to do this.
In Figure 13.7, the Display Preferences were changed, to hide the relationship names.
Select different combinations of entities, and play with the facilities on the layout toolbar. Once you get used to them, they’ll enable you to make clear, easy-to-follow diagrams quickly. Try the Flip Horizontal and Flip Vertical options on the Disposition menu, too.
Figure 13.17 A finished diagram

Graphical Synonyms
We introduced the concept of graphical synonyms in Chapter 10. Remember, a graphical synonym is an additional symbol for an object on a diagram. Sometimes, creating multiple symbols for an object in a diagram can improve readability by reducing the length or complexity of links. You create a graphical synonym by right-clicking a symbol and selecting Edit|Create Graphical Synonym.
You can create as many graphical synonyms as you want within the same diagram. You can even create graphical synonyms of graphical synonyms, and of object shortcuts. Each graphical synonym displays the name of the object followed by a colon and the number of the synonym. In Figure 13.18, Contact : 1 and Contact : 2 both represent the Contact entity.
If you create a Graphical Synonym from a relationship, graphical synonyms of the related entities are also created. Note that though you cannot visually distinguish a graphical synonym of a relationship from a normal relationship (unless you display the name attribute), when you select a link symbol, it is identified as a graphical synonym in its tooltip.
You can create Graphical Synonyms for any data model symbols except for inheritances and inheritance links in the CDM and LDM.
Figure 13.18 Graphical synonyms

You can move relationships between graphical synonyms if you want to – to create Figure 13.18, I dragged the end handle of the inheritance link (the arrow head) from Contact : 1 to Contact : 2. If you wish, you could edit the Display Preferences for one of the graphical synonyms to show different content – I did this in Figure 13.18.
If you delete a graphical synonym, all of its linked symbols are connected to one of the other graphical synonyms, or the original symbol, if the last graphical synonym has been removed.
It is possible to create Graphical Synonyms accidentally, by dragging a relationship onto a diagram; if one or both of the related entities is already present on the diagram, graphical synonyms are created. To avoid this happening, hold down the <Shift> key when you drag the relationship onto the diagram.
YOUR TURN TO PLAY
- Select all of the symbols in your diagram, and right-click on one of the symbols. Select Create Diagram from Selection to create an identical diagram.
- In the new diagram, select entity C, and then select Create Graphical Synonym on the Edit menu. Drag the new symbol to the left of entity C : 1. Now select the request relationship, and drag the top handle to the center of entity C : 2. That part of the diagram should now look like Figure 13.19.
Figure 13.19 Two copies of the entity

3. Open the property sheet for the request relationship to confirm that it’s still connected to entity C. Now delete either of the symbols for entity C; all the relationships are now connected to the remaining symbol.
Many-to-many relationships
To create a many-to-many relationship in a CDM, create a relationship as you would normally, then select the ‘many-to-many’ option on the ‘Cardinalities’ tab.
By default, the LDM does not support many-to-many relationships. You can enable them if you want to via the model options (they are disabled by default).
 PowerDesigner refers to ‘many-to-many’ relationships as ‘n-n’ relationships, so the option is called ‘Allow n-n relationships’.
There is a special tool  in the LDM palette for creating many-to-many relationships. When you connect two entities using this tool, PowerDesigner will do one of two things, depending on whether or not ‘n-n relationships’ have been enabled via the Model Options:
Disabled | PowerDesigner will create a new entity instead of a relationship, with one-to-many dependent relationships to the two entities you wanted to relate to each other. See the first example in Figure 13.20. |
Enabled | PowerDesigner will draw a many-to-many relationship. See the second example in Figure 13.20. |
Figure 13.20 Many-to-many relationships in the LDM

When you generate a new model, how many-to-many relationships are treated depends on the options available in the new (target) model. See Table 13.4 for details.
Table 13.4 Many-to-many relationships and model generation
Target Model Type | Action |
CDM | Identical many-to-many relationships generated. |
LDM | Before you generate the target model, you can change the model options to enable many-to-many relationships. However, many-to-many relationships always resolve into an associative entity and two relationships, similar to the first example in Figure 13.20. |
PDM | Many-to-many relationships are converted into an associative table and two references, similar to the first example in Figure 13.20. |
YOUR TURN TO PLAY
- Create a new LDM called ‘Chapter 13’ in your ‘Chapter 13’ folder. Draw four entities in this pattern:
A B
C D
2. Check the model options, making sure that ‘Allow n-n relationships’ is not selected. Now select the ‘n-n Relationship’ tool , and draw a relationship from entity A to entity B. PowerDesigner will automatically create an ‘associative’ entity and two relationships, as shown in Figure 13.21.
Figure 13.21 The new associative entity

3. Change the model options to allow n-n relationships, and draw a many-to-many relationship from entity C to entity D. This time, the result is a single many-to-many relationship.
4. Draw a one-to-many relationship from entity C to entity D. Your diagram should now look like Figure 13.22.
Figure 13.22 Our three relationships

5. Open the contextual menu for Relationship_5, and select Change to Entity. The relationship will be converted into an entity and two relationships. Note that the original cardinalities have been preserved – an instance of entity D can still only be related to one instance of entity C.
6. Now change the model options again, to disable n-n relationships. Did you see what happened to the many-to-many relationship, Relationship_4? It was converted into an entity and two relationships.
7. Save the model.
If you right-click any relationship, and select Change to Entity, PowerDesigner will convert the relationship into an entity and two relationships.
Resolving Many-to-many Relationships
Converting a many-to-many relationship into a new entity and two relationships is often referred to as ‘resolving’ the many-to-many relationship. The new entity is referred to as an ‘associative’ entity. The simplest way to resolve a many-to-many relationship in PowerDesigner is to right-click it in the Browser or on a diagram, and select Change to Entity on the contextual menu. The name of the new entity will be the same as the name of the original relationship.
![]() “Changing a Relationship into an Associative Entity” (Data Modeling)
“Changing a Relationship into an Associative Entity” (Data Modeling)
Recursive (Reflexive) Relationships
Recursive relationships are simple to draw from the palette; in fact you may create them by accident. When drawing the relationship, click once on the entity symbol, drag the mouse a short distance inside the symbol, and then release the mouse button.
Remember that PowerDesigner uses the term ‘reflexive’, rather than ‘recursive’. In PowerDesigner, you can make one or both ends of a reflexive relationship mandatory, and even make the relationship dependent, causing potential problems when you generate further models. Fortunately, the model checker does report these for you.
YOUR TURN TO PLAY
Carry on working in your LDM. Draw a relationship from entity A to itself. Simple, isn’t it?
![]() “Creating a Reflexive Relationship” (Data Modeling)
“Creating a Reflexive Relationship” (Data Modeling)
Subtypes in PowerDesigner
In PowerDesigner, subtype structures are called ‘Inheritances’, and the links between entities and the subtype symbol are called ‘Inheritance Links’. The modeling notations support them in different ways (see Chapter 9). Each Inheritance is an object in its own right, so it has a default name; in Figure 13.23, I chose to change the name to Ice Cream Container, reflecting the name of the supertype entity.
Figure 13.23 Inheritance with two child entities

 It’s a good idea to give inheritances meaningful names, so you can tell them apart in the Browser.
The Inheritance is represented by the half-moon symbol; the arrow points to the parent (supertype) entity, and the straight lines link the child (subtype) entities. The ‘X’ in the Inheritance symbol tells us that the subtypes are mutually exclusive – an Ice Cream Container cannot be both an Ice Cream Cup and an Ice Cream Cone at the same time. The double line at the bottom of the half-moon tells us that the list is complete – there are no more children (subtypes). A single line would indicate that there may be other subtypes that are not shown on the diagram.
Creating an inheritance via the palette is subtly different from creating a standard relationship. To create a new inheritance, instead of dragging from parent to child, you must drag the link from the child to the parent entity – the subtype node is created for you, as shown in Figure 13.24. For further inheritance links, drag from the child entity to the half-moon symbol, or add the child entity via the ‘Children’ tab in the Inheritance property sheet.
Figure 13.24 Creating an inheritance from the palette


PowerDesigner will let you create more than one inheritance for a given parent entity; this is unusual, but not illegal in conceptual data modeling. For example, your analysis may reveal that some cones and cups are perishable, and others are not. Perishable containers have specific attributes (such as the shelf life) and relationships. There are several different ways to represent this in a data model. Which method you choose will depend on the purpose of your data model. If you want to make the distinction crystal-clear in a Subject Area Model, you could add new subtypes of Ice Cream Container, called Perishable Container and Non-perishable Container. The left-hand image in Figure 13.25 shows the new subtypes within the same hierarchy as the original subtypes. The problem with this model is the subtypes themselves – a given instance of Ice Cream Container cannot be allocated to just one of the subtypes. An Ice Cream Cone must also be perishable or non-perishable. This issue is referred to as overlapping subtypes, and it will cause problems in implementation. 
Figure 13.25 Two hierarchies or one?


The right-hand image in Figure 13.25 shows the new subtypes in a separate inheritance structure. A given instance of Ice Cream Container can now be represented by two subtypes – in effect, there are two separate categorization schemes for Ice Cream Containers.
Inheritance Properties
To view or edit an inheritance's properties, double-click its diagram symbol, or entry in the Browser or a list. Figure 13.26 illustrates the ‘General’ tab of the property sheet.
Figure 13.26 Inheritance properties – ‘General’ tab

This is where you give the inheritance a name, select the parent entity, and provide two pieces of information about the set of child entities – exclusivity and completeness:
Mutually Exclusive Children | When selected, the subtypes are mutually exclusive, meaning an entity instance must be one or the other of the subtypes, but cannot be more than one of them at the same time. In Figure 13.24, an Ice Cream Container could not be both an Ice Cream Cone and an Ice Cream Cup. When ‘Mutually Exclusive Children’ is selected, the Inheritance symbol displays an X, as in Figure 13.23. |
Complete | When selected, the list of children is complete – every instance of the parent entity must also be an instance of one of the children. If the example in Figure 13.24 is marked as ‘Complete’, then every Ice Cream Container must be either an Ice Cream Cone or an Ice Cream Cup. When ‘Complete’ is selected, the Inheritance symbol displays a double line on the base, as in Figure 13.23. |
The ‘Generation’ tab, shown in Figure 13.27, allows you to specify how the inheritance structure will be generated to a PDM. It also allows you to decide which sets of attributes will be inherited by child entities in the LDM. Refer to Table 13.5 for a description of the results of each choice on this tab.
Figure 13.27 Inheritance properties – ‘Generation’ tab

Table 13.5 Generation policy
Choice | Result |
Generate parent | When a PDM is generated, this causes the PDM to contain a table corresponding to the parent entity. If one or more child tables are not generated, the parent will take on their columns and references. |
Generate children | In the LDM, this property determines the way in which attributes from the parent entity are inherited by child entities. This is not relevant in the CDM, because attribute inheritance is not supported in the CDM. When a PDM is generated, this causes the PDM to contain a table corresponding to each child entity. The primary key of each child table is the concatenation of the child entity identifier and the parent entity identifier. You must additionally choose between: Inherit all attributes – Each table inherits all the attributes of the parent entity Inherit only primary attributes - Each table inherits only the identifier of the parent entity. |
You can control the generation of individual child tables using the Generate option in the property sheet of each child entity.
If you choose to generate the parent table and not the children, the Specifying Attributes property allows you to define one or more new attributes to differentiate between occurrences of the children. In the example shown in Figure 13.28, we may wish to add an attribute called ‘Contact Type’, with values of ‘Person’ and ‘Company’.
The ‘Specifying Attributes’ are shown in the property sheet for the parent and child entities, but they can only be edited via the Inheritance. These attributes will be removed from the Inheritance if you select ‘Generate Children’.
The ‘Children’ tab, shown in Figure 13.28, allows you to view the list of child entities; you can also add or remove child entities here.
Figure 13.28 Inheritance properties – ‘Children’ tab

YOUR TURN TO PLAY
- Create a new diagram in your LDM, and follow the steps shown in Figure 13.24 to create a hierarchy of three entities. Add the following attributes to the Contact entity: Contact Identifier, Name, Telephone Number. Ensure that Contact Identifier is flagged as part of the primary key.
- Notice that all three attributes are inherited in the child entities. Open the property sheet for one of the child entities; note that the attributes are not editable here. Open the property sheet for one of the child attributes, and see that it says it’s inherited from Contact.attribute name. Click on the properties tool to the right of that entry to open the property sheet for the parent attribute.
- Open the ‘Generation’ tab on the property sheet for the inheritance (the half moon symbol); select ‘Inherit only primary attributes’, and press <OK>. Two attributes disappear from each of the child entities. Remember though, that they are implicitly still present. An Ice Cream Cup is an instance of Ice Cream Container, and inherits all the attributes and relationships of the parent entity – PowerDesigner gives you the option of hiding or showing all of the inherited attributes.
If you want to show more than just the primary key attributes in child entities, but hide some of the other inherited attributes, you can. Remember the Displayed property on every attribute? It is available for inherited attributes as well – uncheck the Displayed property for an attribute and it will never appear on a diagram. The attribute will still exist, and will be generated into new models, unless you uncheck the Generate property. Remember that you can also hide attributes in a given entity via the ‘Sub-Objects’ tab on the Symbol Format dialogue, accessible via the contextual menu for the entity symbol.
YOUR TURN TO PLAY
Open the property sheet for the inheritance you created earlier. In the ‘Generate’ tab, uncheck ‘Generate Children’; the ‘Specifying Attributes’ properties are now available. Here you can create one or more specifying attributes in the parent entity, which differentiate between occurrences of each child. Create an attribute here called Contact Type, and click <OK>. The Contact Type attribute appears in the entity, but can only be edited via the inheritance.
If you enable the ‘Generate Children’ option, the specifying attribute(s) are deleted from the parent. If you want to keep them, copy them to another entity first.
Subtypes in Barker Notation
The Barker notation does not use inheritances to represent subtypes. Instead, subtypes are represented by placing the child entities inside the parent entity symbol, as shown in Figure 13.29.
Figure 13.29 Barker subtypes

To make an entity a subtype of another entity, just drag it onto the supertype entity symbol, and drop it when a small ‘+’ symbol appears. You can also drag and drop in the Browser. To create a brand-new subtype entity, there are three options:
· Open a diagram, select the Entity tool as if you were drawing entities, then click within the supertype symbol.
· Via the ‘Subtypes’ tab in the property sheet for the supertype entity
· In the Browser, right-click the supertype entity, then select New|Entity from the contextual menu.
You can’t ‘hide’ subtypes via Show symbols, but you can delete the entity symbols.
If you know the entity has subtypes but they are not shown on the diagram, check the display preferences for entities; ensure that ‘Composite Editable view’ is selected. If you need to adjust the size of the supertype symbol, select it and press <Ctrl+J>.
To include a subtype entity onto a diagram, drag it onto the diagram from the Browser. If you drop it onto a supertype symbol, it will be nested within the supertype symbol. If you drop it onto an empty area of the diagram, a supertype symbol will be added (as a graphical synonym if necessary).
Including Missing Relationships
As you work on a data model, you may create more than one diagram, create objects in the Browser, or remove symbols from diagrams. All of these activities may result in symbols being missing from a given diagram. We have already discussed the two ways of including missing symbols:
Show Symbols See “Showing and Hiding Symbols”, in Chapter 10
Complete Links See “Showing and Hiding Symbols”, in Chapter 10
The Complete Links command is available on the Tools menu, and via the Complete Links tool  on the standard Toolbar. When you run the command, any link that could be on the diagram is automatically included – this includes relationships, inheritance links and traceability links. If you have any symbols selected when you run the command, you will have the option to complete links for the whole model or just the selected symbols.
In Figure 13.30 for example, Entity_9 appears to be unconnected to any other entity on the diagram.
Figure 13.30 An unconnected entity
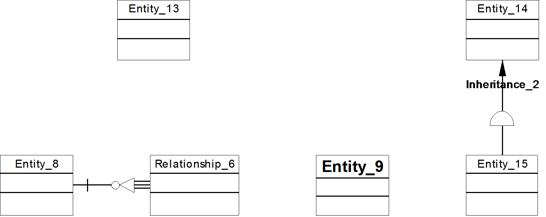
Figure 13.31 shows the diagram after selecting Entity_9 and running Complete Links. The diagram now has an additional relationship, an inheritance link, and a traceability link, all connected to Entity_9. Remember, these connections already existed, all we’ve done is include them on the diagram.
Figure 13.31 Connections added

YOUR TURN TO PLAY
Create a new diagram in your LDM. In the Browser, select the inheritance you created earlier, and drag it onto the diagram. PowerDesigner adds the inheritance and the parent entity to the diagram, but not the child entities. Now select Show Symbols via the Symbol menu, or right-click the diagram background and select Diagram|Show Symbols. In the ‘Inheritance Link’ tab, shown in Figure 13.32, you will see the child entities listed. If you have more than one inheritance in your model, check the Name property shown in the list – it’s a composite value, derived from the names of the parent entity, the inheritance, and the child entity.
Figure 13.32 Selecting your inheritance links

Use the ‘Select All’ tool (circled above) to select all the inheritance links, and click on <OK>. The child entities are added to the diagram, complete with links to the inheritance.
The quickest way to add a missing inheritance structure is to add all the inheritance links via Show Symbols – this will add the parent and child entities, the inheritance, and all the links.
YOUR TURN TO PLAY
Now drag all the remaining entities onto the diagram; note that none of the relationships have been included. Now click on the ‘Complete Links’ tool – all the missing relationships have been added. Select all the newly-added entities and relationships and experiment with auto-layout – use the auto-layout tool  on the layout Toolbar.
![]() “Inheritances (CDM/LDM)” (Data Modeling)
“Inheritances (CDM/LDM)” (Data Modeling)
EXERCISE 11: Creating Relationships in PowerDesigner
Create a new Project in your workspace, called ‘Exercise 11’; make sure the project directory has the same parent directory as the previous projects you created. Create a LDM in the Project, also called ‘Exercise 11’. Add the extension ‘Relationship Assertion with Plural Entity Names’ to the model (see instructions in Chapter 10).
Create the model shown in Figure 13.33. Concentrate on the diagram contents, don’t worry about definitions or attribute properties. You will use this model again in Exercise 18.
Figure 13.33 The target model

EXERCISE 12: Naming an Associative Entity
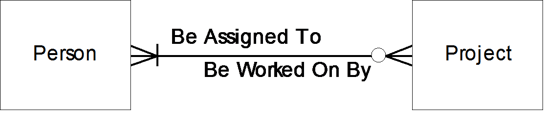
Figure 13.34 illustrates a common scenario in a Conceptual Data Model, of a many-to-many relationship between two entities. In this example, a person can be assigned to many or no projects, and a project must have at least one person working on it.
Figure 13.34 A many-to-many relationship
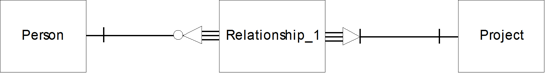
In a Logical Data Model, we decide to resolve this relationship, and convert it into an entity, and the result is shown in Figure 13.35. What names do you suggest we use for the two relationships and the associative entity?
Figure 13.35 The entity and relationships to rename
Key Points · PowerDesigner supports every type of relationship. · Agree on standards for relationship and inheritance names and for using role names. · Draw relationships from the 'one' entity to the 'many entity'. · Draw a new inheritance from the child to the parent, and draw inheritance links from the child entity to the sub-type symbol. · Let PowerDesigner manage relationship routing for you. · The property sheet includes a depiction of the relationship - use this to confirm your changes before you click <ok>. · The ‘Cardinalities’ tab is where you specify how two entities are related. · The entity 'Dependencies' tab lists relationships. · Use 'Show Symbols' to add existing relationships to a diagram. · You can convert a relationship into an entity. · Use graphical synonyms to improve readability of a diagram. · By default, all parent attributes are inherited by child entities. · Rules that you cannot describe using relationships can be defined as Business Rules. |