
CHAPTER 19
How do we put all of the pieces together?
Practice, and practice
Create, generate, export
Follow all the steps
In this chapter there is a set of tasks for you to follow – complete these tasks, and you will have built your own data model pyramid. Please remember that this chapter is intended to provide practice using PowerDesigner, it is not a lesson in database design!
Your Tasks
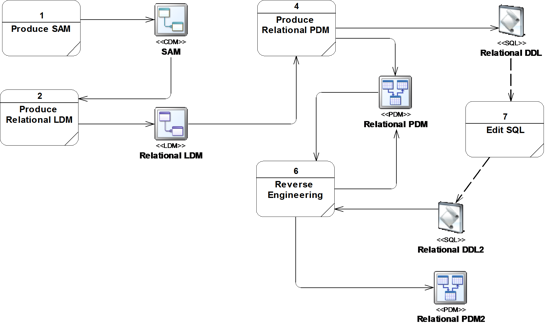
You will start from a blank canvas, and create four models and two files of SQL. Figure 19.1 shows the steps you will take to create the models. Each solid line represents a use of the model generation feature to create or update a model.
In this chapter, we describe what you need to do, we do not tell you how to do it. We suggest you create a special project, but that is up to you. We also suggest that you attach the following model extensions to all your models:
· Excel Import
· Relationship Assertion with Plural Entity Names.
To completely match the appearance of the target models, you will need to adjust model options and display preferences.
Produce Subject Area Model
Figure 19.2 is your objective, a simple Subject Area Model with six entities, two of which are subtypes of Contact.
Figure 19.2 Your subject area model

Describe the entities yourself, and create some basic documentation from the model in the form of a report. When you create the report, use the ‘Standard Conceptual report’ template.
Produce Relational LDM
Generate the LDM from your Subject Area Model, making sure you keep the generation dependencies. Add domains, attributes, and identifiers, and convert the many-to-many relationships into entities. Make sure you describe all the entities and attributes.
Figure 19.3 shows your target model, split across two separate images. The images are from the same PowerDesigner diagram – note the use of graphical synonyms for the Contact entity, allowing us to separate the inheritance hierarchy from the rest of the model.
Table 19.1 contains details of the domains you need to complete – copy these into an Excel spreadsheet, and import them into your model.
Use a dependency matrix to link attributes to domains.
Create a second diagram with an alternative view of the model. Use the display preferences and auto-layout feature to mimic the diagram shown in Figure 19.4.
Figure 19.3 The relational LDM


Table 19.1 LDM Domains
Name | Data Type | Length |
Address Line Text | Characters (40) | 40 |
City Name | Characters (40) | 40 |
Company Name | Characters (40) | 40 |
Email Address | Characters (50) | 50 |
Image | Image |
|
ISO Country Code 2-Character | Characters (2) | 2 |
Person Name Part | Characters (40) | 40 |
Person Title | Characters (15) | 15 |
Phone Number | Characters (25) | 25 |
Postal Code | Characters (15) | 15 |
Standard Description | Characters (40) | 40 |
Standard Identifier | Number (16) | 16 |
State Province Code | Characters (2) | 2 |
Web Address | Characters (100) | 100 |
Figure 19.4 An alternative view

Produce Relational PDM
There will be two iterations in this process. For the first iteration, create the model shown in Figure 19.5. Take a close look at Figure 19.5 before you generate the PDM, as you will need to adjust the generation options in the LDM.
Generate the PDM from your LDM, making sure you keep the generation dependencies.
Figure 19.5 Target PDM – 1st iteration

In the second iteration, adjust the generation options for the inheritance in the LDM, then re-generate the PDM. Figure 19.6 shows the required results for the supertype and subtypes this time.
Figure 19.6 2nd iteration – where the differences lie

Create a new diagram containing the tables shown in Figure 19.7, and then create the view that is also shown in the diagram, using the wizard on the Tools menu. Create the dashed lines shown on Figure 19.7 by drawing traceability links from the view to each table.
Figure 19.7 The view

Now it’s time to do some denormalization. Collapse the Person and Company tables into Contact, making sure to keep the original tables. Set the Generate property to ‘False’ in the original tables, and delete the references that connect the original tables to the rest of the model. Use column denormalization to replicate the columns shown in the diagram in bold type. There are also other changes you need to make – check the diagram carefully.
Figure 19.8 The denormalized model

Generate a SQL File
Generate a single file of SQL from the PDM.
Reverse Engineering
Create a new PDM by reverse-engineering from the SQL file. Make some changes to the new model, then save the model and compare it to the original PDM. Your new model will look something like Figure 19.8. How closely it matches will depend on the changes you made to the SQL.
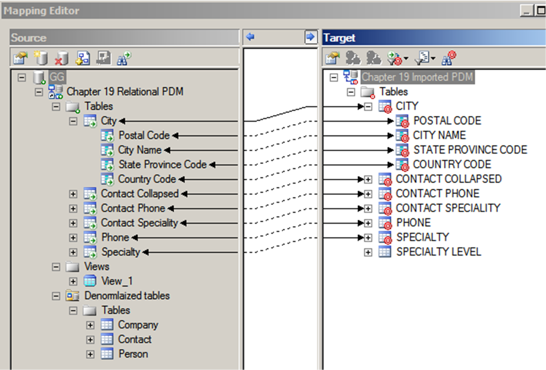
A good way to visualize the similarities and differences is to run the Mapping Editor, If you create the default mappings, the result will be similar to Figure 19.9. Make sure you keep the mappings.
Figure 19.9 Really close mappings
You’ve reached the end of this exercise, but not the end of the book.
Take time to flesh out the models with descriptions, use the Excel Import to provide comments for your tables and columns, and create list reports and matrices. Practice, and then practice some more.
Key Points · The chapter leads you through a top-down approach. You’re likely to use a combination of top-down and bottom-up in the real world. · Dependency matrices and Excel Imports can reduce the time it takes to create a model. · Use different diagrams to present to different audiences. · Use graphical synonyms to your advantage. |