3
Image and Video Quality Assessment: Perception, Psychophysical Models, and Algorithms
Anush K. Moorthy, Kalpana Seshadrinathan and Alan C. Bovik
3.2 Computational Modeling of Human Vision
3.3 Subjective Quality and Performance Evaluation
3.4 Algorithmic Measurement of Perceptual Quality
3.4.1 Image Quality Assessment
3.4.1.1 FR IQA: Human Visual System-Based Approaches
3.4.1.2 FR IQA: NSS-Based Approaches
3.4.1.3 FR IQA: Feature-Based Approaches
3.4.1.4 NR IQA: Distortion-Specific Algorithms
3.4.1.5 NR IQA: Holistic Algorithms
3.4.2 Video Quality Assessment
3.4.2.1 FR VQA: Models Based on the Human Visual System
3.4.2.2 FR VQA: Feature-Based Approaches
3.4.2.3 FR VQA: Motion Modeling-Based Approaches
3.4.2.5 NR VQA: Other Techniques
3.5 Current and Future Research in Quality Assessment
3.1 Introduction
As of June 2010, Internet video accounted for over one-third of all consumer Internet traffic, and predictions indicate that Internet video will account for more than 57% of all consumer traffic by 2014 [1]. Predictions also indicate that advanced Internet video, which includes high-definition and stereoscopic video, will increase by a factor of 23 by 2014, compared to 2009. The sum of all forms of video, including television, video on demand, Internet, and peer-to-peer video streaming, will constitute more than 91% of global consumer traffic [1]. At the end of 2010, video accounted for almost 50% of mobile data traffic, and it is predicted that more than 75% of mobile traffic will be video in 2015 [2]. These numbers indicate that video – either on mobile devices or otherwise – is fast becoming an integral part of a daily life and will continue to do so for the next few years as well.
Today’s average user is spoiled for choice, since visual entertainment is available at the touch of a button over a variety of devices that encompass a range of resolutions and which are capable of displaying visual stimuli with varying degrees of acceptability. The palatability of a visual signal is not a function of the display device alone however, since the stimulus that the user receives passes through a variety of stages that could possibly induce certain artifacts in the signal that make the stimulus unacceptable or unpalatable. Think of the blocky video or the sudden freezes that one experiences when viewing movies on the Internet. The former is due to the heavy quantization (and hence high compression) that was used in the creation and storage of the video, while the latter is due to a decrease in the allocated bandwidth leading to an empty buffer. In either case, the introduction of these compression or frame-freeze artifacts reduce the palatability of the visual stimulus. Visual quality assessment refers to gauging such palatability of a visual stimulus. Since humans are the ultimate viewers of such stimuli, human opinion on quality is representative of the palatability of visual signals. Such human opinion on visual quality is generally gauged using a large-scale study where human observers view and rate visual stimuli (images/videos) on a particular rating scale (say, 1 to 5, where 1 is bad and 5 is excellent) and such assessment of visual quality is referred to as subjective quality assessment. Subjective assessment of quality is not only time-consuming and cumbersome, but is also impractical and hence there is a need to develop algorithms that are capable of assessing the perceptual quality of a visual stimulus such that the scores generated by the algorithm correlate well with subjective opinion. Such automatic assessment of visual quality is referred to as objective quality assessment.
Automatic image quality assessment (IQA) and video quality assessment (VQA) algorithms are generally classified into three broad categories based on the amount of information that the algorithm has access to:
Full-reference (FR) approaches, where the algorithm has access to not only the distorted stimulus whose quality is to be assessed but also the clean, pristine, reference stimulus with respect to which such quality assessment is performed.
Reduced-reference (RR) approaches, where apart from the distorted stimulus, the algorithm has access to some information regarding the original, pristine stimulus (for example, from a side-channel), but not the original reference stimulus itself.
No-reference (NR) approaches, which only have access to the distorted stimulus.
The three approaches are summarized in Figure 3.1. The reader will readily infer that as one moves from the FR to the NR realm, the difficulty of the problem increases, and it is no surprise that most research has revolved around the development of FR algorithms. Although NR algorithms are the holy grail of quality assessment (QA) research, development of FR algorithms lends one insight into various aspects of QA algorithm design and hence FR QA algorithms pave the way for the development of state-of-the-art NR QA algorithms. Finally, RR QA algorithms remain of interest, not only as a stepping-stone toward NR QA but also as feasible solutions to the problem.
Apart from predicting perceptual quality, QA algorithms can be deployed for a variety of purposes. For example, a QA algorithm can be used for the perceptual optimization of a multimedia service; that is, transmission/display parameters of the signal may be varied in order to maximize perceptual quality, and hence the quality of experience (QoE). Other applications include benchmarking image processing algorithms, utilization of perceptual quality measures as optimization objectives for image enhancement algorithms, rate control using quality, rate-distortion optimization, visually lossless compression and so on.
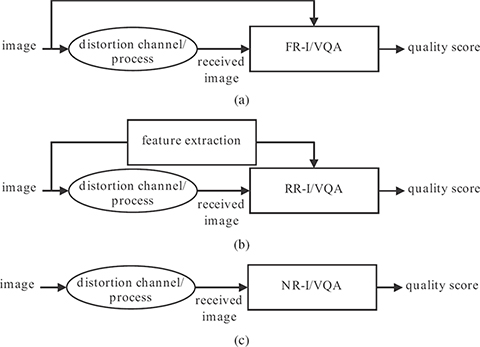
FIGURE 3.1
Taxonomy of quality assessment approaches. Full-reference approaches have access to both the original and the distorted signal, reduced reference approaches have access to some information regarding the original (through the supplementary channel here for example), and no-reference approaches have access only to the distorted stimulus whose quality is be assessed. (a) Full-reference quality assessment, (b) reduced-reference quality assessment, and (c) no-reference quality assessment.
Having described FR QA algorithms, the reader would presume that the simple mean-squared-error (MSE), which has been an engineer’s tool of choice for comparison of two signals is an ideal candidate for FR visual quality assessment. The MSE between two N-dimensional vectors x and y is defined as
A low MSE value indicates that the two vectors are similar. In order to follow a convention where a higher value indicates greater similarity, the peak signal-to-noise ratio (PSNR) is utilized. The PSNR is defined as follows:
where L is the dynamic range of the pixel values (for example, L = 255 for grayscale images). Throughout this chapter, MSE and PSNR are used interchangeably.

FIGURE 3.2
Example of why MSE is a poor measure of quality. The distortion is visible on the face of the woman, but not in the background on the chair or on the scarf where MSE still accounts for it.
The engineer’s attachment to the MSE is not without reason. The MSE has several elegant properties, including but not limited to, simplicity, memoryless-ness, convexity, symmetry, and differentiability. With so much going for it, MSE should have been an ideal FR measure of quality, however, it is not [3], [4]. The major reason for this is that while MSE is a good indicator of differences between two signals, in the case of visual signals existence of such differences does not imply that these differences are perceived by the human observer, since not all differences are equally significant for the human. This is best illustrated by the image in Figure 3.2. The image has been distorted uniformly with additive white noise; however, the noise on the face of the woman is prominent, while one would be hard-pressed to quantify the distortion on the chair in the background or the scarf. MSE, however, would identify the distortion in the background and quantify it with equal weight as the distortion on the face, thereby making it a poor measure of perceptual quality. This phenomena, where the content of the image masks the presence of distortion, is referred to as contrast masking and will be discussed in the next section. It is hence that one needs to design algorithms that are capable of assessing the human perceived quality of a visual signal.
Quality assessment algorithms are of tremendous practical interest, and hence their design has attracted tremendous research interest. Since humans are the ultimate receivers of these visual signals, it is only logical that researchers first approached the QA problem by attempting to model the various features of the human visual system (HVS). Hence, Section 3.2 presents various salient features of the HVS. Section 3.3 summarizes how one would evaluate a quality assessment algorithm and directs the reader to many publicly available quality assessment databases for images and videos. Then, Section 3.4 describes a number of image and video quality assessment algorithms, not only those based on the HVS but also those that are based on feature-extraction and natural scene statistics as well. Since FR QA has been an active area of research for some time, leading FR QA approaches are discussed, and since it is believed that NR approaches for QA are rapidly achieving competitive performance, approaches to NR QA are summarized as well. Section 3.5 outlines current and future areas of interest in the field of quality assessment research. Finally, this chapter concludes with Section 3.6.
3.2 Computational Modeling of Human Vision
The goal of perceptual quality assessment is to model and predict human behaviour in assessing the quality of multimedia signals. With this goal in mind, all IQA/VQA algorithms utilize models of the properties of human vision in some form. This section discusses certain basic properties of human vision and corresponding computational models that have found their way into IQA/VQA algorithms. As shown in this chapter, certain algorithms utilize statistical models of natural images/video in developing an IQA metric. However, since human vision has evolved in response to viewing these natural scenes, natural scene statistical models are also hypothesized to be dual of human vision models, and this duality has been studied in the literature [5].
Vision is one of the most important senses that humans use to perceive the outside world. The HVS is an extremely complex system that has evolved to perform a number of different functions using visual stimuli that are acquired using the optical components of the eyes. Vision in humans and various animals has been studied by neuroscientists for centuries and while tremendous progress has been achieved over the years, visual processing is still not completely understood.
Within the context of visual quality assessment, several properties of human vision are particularly relevant and research has focused on adoption of computational models of these in IQA/VQA. Two types of models of the HVS – behavioral models and neuronal models – have both been used extensively in IQA/VQA. Behavioral models attempt to use data derived from experiments performed with human users and examples include determination of threshold sensitivity models for luminance masking and contrast sensitivity. Neuronal models are derived from experimental recordings from neurons in animals and such data have also been used in IQA/VQA [6], [7]. Several models of the HVS that have been incorporated into IQA/VQA algorithms have focused on modeling the early stages of visual processing of which a fairly good understanding has been reached over the years and this includes processing that occurs in the retina and the so-called area V1 of the visual cortex. More recent algorithms attempt to focus on some of the higher-order processing that occurs farther downstream, including in the extra-striate cortex, to account for motion perception, saliency, and so on [7], [8], [9].
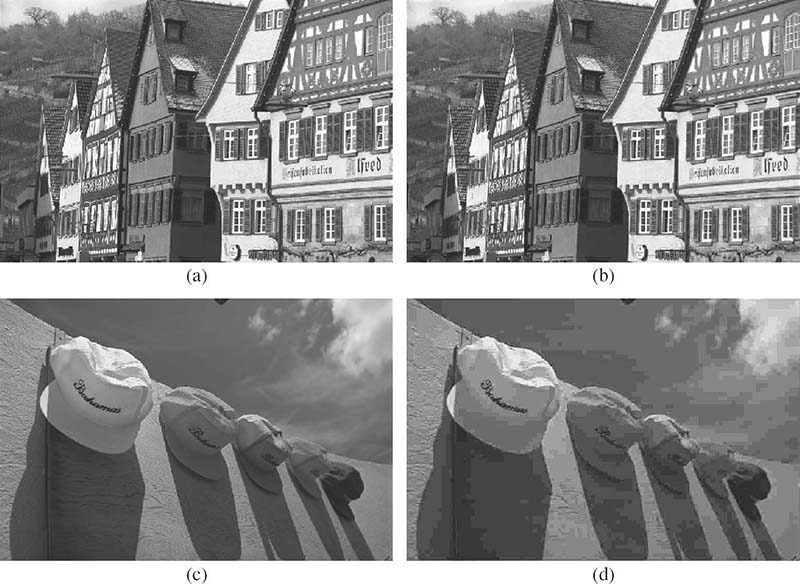
FIGURE 3.3 (See color insert.)
The effect of the contrast masking property of human vision on visual quality using JPEG compression: (a) original Building image, (b) its distorted version with MSE = 134.61, (c) original Caps image, and (d) its distorted version with MSE = 129.24. The distorted images clearly differ in their visual quality, although they have similar MSE with respect to the original.
Three properties of human vision – luminance sensitivity, contrast sensitivity, and contrast masking – have received a good deal of attention in the literature. Human perception of brightness is not linear, and a well-known law governing perception known as the Weber-Fechner law stipulates that over a large dynamic range, and for many parameters, the threshold of discrimination between two stimuli increases linearly with stimulus intensity. A commonly used model to account for Weber’s law stipulates that the ratio of discrimination threshold to the input stimulus intensity is a constant over a specified range of stimulus intensity. The sensitivity of the human eye for sinusoidal illuminance changes as a function of spatial frequency was studied in Reference [10], and it was shown that human perception of brightness follows Weber’s law over a broad range of stimulus strength.
Spatial contrast sensitivity of vision refers to differences in sensitivities to stimuli of varying spatial frequencies of equal strength. The spatial contrast sensitivity function of human vision shows a bandpass shape with reduced sensitivity to low and high spatial frequencies [11], [12]. In fact, the reduced sensitivity of human vision to higher spatial frequencies is exploited in lossy compression of images and video using Joint Photographic Experts Group (JPEG) or Moving Picture Experts Group (MPEG) coding to provide substantial gains in compression efficiency.
Contrast masking, also termed as texture masking, refers to the reduction in visibility of one signal component due to the presence of a similar signal component at adjacent spatial locations, spatial frequency, or orientation. Contrast masking, as relevant to image quality, is illustrated in Figure 3.3. The distorted images shown in Figures 3.3b and 3.3d have approximately the same MSE with respect to the original images shown in Figures 3.3a and 3.3c, respectively. However, the visibility of artifacts in these images are clearly very different. The reason for this difference is contrast masking in vision, where strong edges and textures in the Buildings image mask the visibility of distortions. However, artifacts are clearly visible in the predominantly smooth Caps image. This simple example clearly shows the importance of accounting for contrast masking in visual quality assessment.
Contrast masking has been studied extensively in the literature and psychophysical studies of this phenomenon that have influenced QA can be found, for example, in References [13], [14], [15], [16], and [17]. Masking models often take the form of a divisive normalization of the energy/intensity of the test or noise signal by the reference image and predict the level of distortion to which an image can be exposed before the alteration is apparent to a human observer. Recent work has also studied the relationship between masking models and IQA indices, such as SSIM and VIF, which are not derived using the HVS models, but based on hypotheses regarding human response to structural distortions and natural scene statistical models, respectively [18]. Most existing IQA/VQA methods utilize some modeling of the contrast masking property of human vision, which is a critical component in achieving the ultimate objective of matching human perception of image/video quality.
Several human vision-based VQA algorithms incorporate elaborate models of spatial properties of human vision. However, until recently, VQA algorithms have not successfully incorporated meaningful models of temporal vision that account for motion processing. Many algorithms utilized computational models of the first stage of temporal processing that occurs in area V1 of the visual cortex. These models typically have the form of one or two separable linear filters applied along the temporal dimension of the video. The two filters are usually lowpass and bandpass, to account for the sustained and transient mechanisms that have been identified in human vision [19], [20]. However, the HVS is extremely sensitive to motion and one of its critical functions is the computation of motion information (speed and direction of motion) from visual inputs. It is well known that a large number of neurons in visual area MT/V5, which is part of the extra-striate cortex, are directionally sensitive, and it is believed that area MT plays a significant role in motion perception [21]. This sensitivity to motion is clearly revealed in QA since humans are extremely sensitive to motion-related artifacts in video, such as ghosting, jerkiness, mosquito noise, and motion compensation mismatches. Recently, models of area MT/V5 have been utilized to develop a sophisticated VQA algorithm known as the motion-based video integrity evaluation (MOVIE) index [7], which is described later in this chapter.
Since human sensitivity to color is generally lower than the sensitivity to changes in the luminance information, most IQA/VQA models primarily focus on the luminance channel of images/video with only rudimentary inclusion of color information (for example, a similar or simplified version of the model is applied to the chrominance channels) [22], [23]. Several HVS based algorithms use different color spaces, such as the CIELAB and CIEYUV color spaces, that attempt to approximate the spectral response properties of human vision. In addition to these, the effect of viewing distance on perceived quality has also been studied [22], [24]. The spatial resolution of the HVS is nonuniform with increased resolution at the fovea and with resolution dropping off with eccentricity in the peripheral regions of vision. Many VQA algorithms incorporate models of the viewing distance and the resolution of the display to convert pixel units into units of cycles per degree of viewing angle, which are then used in the rest of the algorithm. A conservative approach taken by several models is to assume the same resolution for the entire image at the specified viewing distance since human subjects can achieve this resolution using eye movements.
3.3 Subjective Quality and Performance Evaluation
Before discussing various visual quality assessment algorithms, the following describes how the performance of a QA algorithm is gauged. This section assumes an algorithm that is capable of producing a measure of quality when given as input the image or video whose quality is to be assessed (and the original for FR algorithms, or additional information for RR algorithms). Given such an algorithm, one seeks to describe its performance in terms of its correlation with human visual perception.
Human perception of quality is generally gauged by large-scale subjective studies in which a number of human observers view and rate distorted visual stimuli on a particular rating scale. Subject rejection procedures are applied in order to reject those subjects whose opinions are markedly different from the average observer, and the opinion scores are averaged across the remaining subjects in order to produce a mean opinion score (MOS), which is representative of the perceived quality of the stimulus. Such subjective studies are generally carried out in controlled environments, where the stimuli are viewed at a fixed viewing distance on a calibrated monitor. Most of the human studies listed below follow the recommendations of the International Telecommunications Union (ITU) [25].
Subjective studies can be single stimulus or double stimulus in nature. Single-stimulus studies are those in which only one stimulus is seen by the subject at a time, and the subject is required to rate that stimulus on its own. In double-stimulus studies, the subject is required to rate the (possibly) distorted stimulus with respect to the pristine reference stimulus, which is displayed as well (usually in a side-by-side arrangement) [25]. It should be obvious that double-stimulus studies generally take twice as much time as single-stimulus studies, which is one reason why single-stimulus studies are common in the literature. Another reason is that single-stimulus studies better simulate the real-world experience of a consumer, who ordinarily does not compare the watched videos side-by-side unless purchasing a display device, such as a television.
A popular methodology that has been adopted by many researchers is the single-stimulus with hidden reference methodology [26], [27]. Here, a single-stimulus study is carried out, and the pristine original reference stimulus is embedded among the stimuli that the subject sees; the score that the subject gives this reference is representative of his or her bias, and in these studies, the score given to the distorted stimulus is subtracted from that given to the reference to form the differential mean opinion score (DMOS), which is representative of the perceived quality of the stimulus – a smaller DMOS indicates better quality.
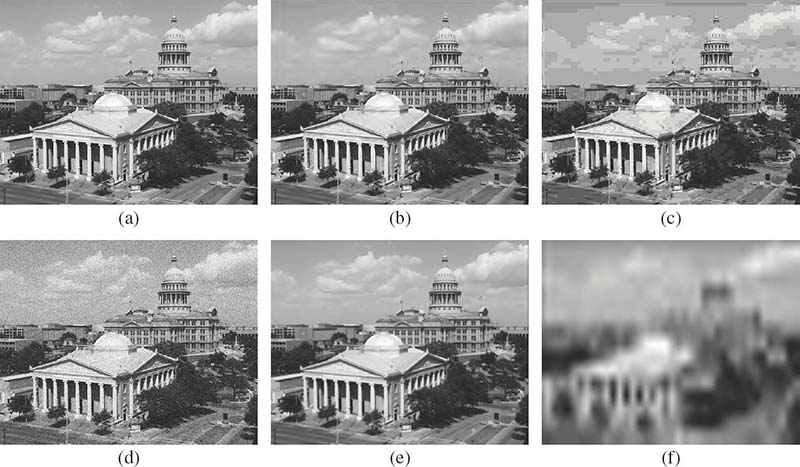
FIGURE 3.4 (See color insert.)
Example distortions from the LIVE IQA database: (a) original image, (b) JPEG2000 compression, (c) JPEG compression, (d) white noise, (e) blur, and (f) Rayleigh fading.
Given a large database of (distorted) visual stimuli with associated DMOS/MOS scores, the scores produced by the algorithm under test for these stimuli are correlated with the MOS/DMOS. Generally, researchers use the following measures of correlation between MOS and algorithm scores: Spearman’s rank ordered correlation coefficient (SROCC) and linear (Pearson’s) correlation coefficient (LCC) [28], [29]. Algorithm scores could correlate nonlinearly or linearly with MOS/DMOS and since SROCC is a nonlinear measure of correlation, SROCC can be directly applied. However, LCC is a linear measure of quality and hence algorithm scores need to be passed through a nonlinearity (referred to as a logistic function) prior to LCC computation. A similar procedure is applied when computing the root mean squared error (RMSE) between the (linearized) algorithm scores and MOS/DMOS. A value close to one for SROCC and LCC and a value close to zero for RMSE indicate good performance in terms of correlation with human perception. The outlier ratio has been sporadically used as a measure of performance as well [29]. Apart from correlations and errors, in order to gauge whether the performance of two algorithms are statistically different, that is, one algorithm is provably better than the other, researchers have used the F-statistic between the residuals obtained from the predicted MOS/DMOS and actual MOS/DMOS [30]. It is here believed that a statistical analysis of performance is a must when evaluating algorithm performance, since higher correlation numbers have no merit, unless backed by the approval of statistical superiority.
Although human studies are time-consuming and cumbersome, their need as a tool for benchmarking QA algorithms emboldens researchers to undertake such studies. In the past, the video quality experts group (VQEG) performed such a large-scale human study in order to benchmark the performance of VQA algorithms [29]. Unfortunately, owing to its poor design [27], [26], none of the algorithms demonstrated better performance than the simple PSNR. The VQEG conducted many other studies, and although some of the data have recently been released for research purposes, copyright issues with regard to content abound [31]. In general, a database has value only if it is publicly available for future benchmarking. A closed dataset, with restricted submissions being evaluated, does not help in algorithm development. By recognizing this fact, various databases have been proposed for image quality assessment in the recent past [30], [32], [33], [34], [35], [36]. One of the first IQA databases was proposed by researchers at the Laboratory for Image and Video Engineering (LIVE) [30], and the LIVE IQA database remains one of the most popular databases for benchmarking, with more than 1500 download requests as of April 2011. The LIVE IQA database was created using 29 reference images, which were distorted using five different distortions – JPEG2000 compression, JPEG compression, white noise, blur, and a Rayleigh fading channel model – leading to a total of 779 distorted images. In order to illustrate how each of these distortions affects visual perception, Figure 3.4 shows a reference image and its various distorted versions.
TABLE 3.1
Summary of various publicly available IQA databases.
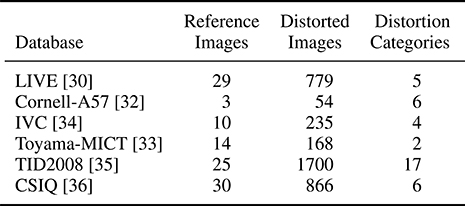
Although the LIVE IQA database is a de facto standard to measure the performance of an IQA algorithm, many other databases have followed. Table 3.1 lists the various IQA databases that are publicly available and details some specifics about these databases, including the number of reference images used, the number of distorted images, and the various distortion categories that were used to simulate the distorted images.
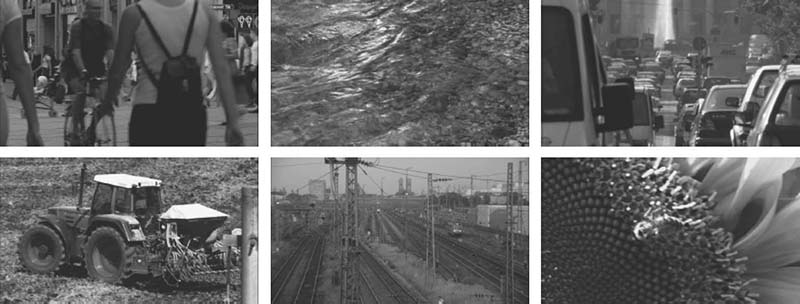
FIGURE 3.5 (See color insert.)
Sample frames from the LIVE VQA database.
Unfortunately, despite the existence of various public databases for benchmarking IQA algorithms, this abundance is not seen in VQA. As mentioned above, the VQEG was primarily responsible for creating one of the first publicly available databases for VQA, and the VQEG phase-I dataset, as it is called, was until recently the de facto standard on which VQA algorithms were tested. However, owing to the poor design of the database, algorithms and humans had difficulty in making perceptual judgments on the quality of the distorted videos. Recently, researchers at LIVE released a database for VQA [27] that complements the popular LIVE IQA database. The LIVE VQA database consists of 10 reference, uncompressed, videos in YUV420p format and 150 distorted videos that were distorted using a variety of distortion techniques, such as MPEG4 compression, H.264 compression, IP packet-losses, and wireless packet-losses [27]. Figure 3.5 shows a subset of the sample frames from the LIVE VQA database in order to give the reader a visual example of the content that the database incorporates.
The LIVE VQA database, which is publicly available for download at no cost to researchers (see Reference [27] for details), also provides the associated DMOS for each of these distorted videos, and it is fast becoming the database on which VQA algorithms are benchmarked. The LIVE VQA database is extremely challenging and clearly demonstrates that PSNR is a poor measure of perceptual quality (see next section). The diverse distortions, along with the carefully conducted human study and the lack of good publicly available VQA databases, makes the LIVE VQA an invaluable asset to researchers in the field of video quality assessment.
3.4 Algorithmic Measurement of Perceptual Quality
Having described the human visual system mechanisms that are relevant to visual quality assessment techniques and having detailed how one assesses the performance of a QA algorithm, this section summarizes some QA algorithms. The summary is broadly divided into image and video quality assessment algorithms.
3.4.1 Image Quality Assessment
A taxonomy of image quality assessment (IQA) algorithms includes those algorithms that seek to model HVS mechanism, those that are based on feature extraction procedures, as well as those that seek to model natural-scene statistics (NSS), which is seen as a dual to the problem of HVS modeling. Figure 3.6 provides a classification of the various IQA algorithms that are summarized below.
3.4.1.1 FR IQA: Human Visual System-Based Approaches
FR QA algorithms based on the HVS generally proceed in the following manner. The image is decomposed using a scale-space orientation decomposition, which is then followed by a masking model that accounts for contrast masking in each of the frequency channels. The masked coefficients of the reference and distorted image are then compared using an error measure, which is generally pooled using a Minkowski summation to produce an error (quality) score. The major difference between the approaches is the choice of the decomposition basis, the parameters of the masking models, and the pooling approach used for collapsing spatial error scores.

FIGURE 3.6
Taxonomy of image quality assessment algorithms summarized in this chapter.
One of the first attempts at modeling human visual system mechanisms for quality assessment was presented in Reference [37]. In this pioneering approach, the authors utilize luminance adaptation and a contrast sensitivity function. However, the model incorporates only a single visual channel, as opposed to a set of channels over the frequency space, and fails to model contrast masking. As noted in Reference [38], the method is equivalent to a weighted MSE, and hence does not perform very well.
The so-called visual difference predictor (VDP) [39] applies a pointwise nonlinearity to the images to model the inherent nonlinearity of visual sensitivity and perception of lightness to luminance, which is followed by a contrast sensitivity function. The image is then decomposed using a modified version of the Cortex transform [40], which models the initial stage of the human detection mechanisms. A masking procedure ensues. The dependence of probability of detection to stimulus contrast is modeled using a psychometric function, and a probability summation is undertaken to produce a quality score.
Reference [41] proposed DCTune as a measure of perceptual quality so that one may design image-dependent perceptual quantization values for DCT-based compression algorithms such as JPEG compression. Luminance masking and contrast masking are modeled in the DCT domain and the obtained coefficients are converted into units of just noticeable differences (JNDs), which are then pooled using probability summations across space and frequencies. As discussed in the original work, the model may be used to design quantization parameters for different images.
The other popular model for HVS-based IQA is presented in Reference [6], where the reference and test images are decomposed using a hex-quadrature mirror filter. The responses are squared and contrast normalization is performed. The vector distance between the reference and test image forms a measure of error and hence of quality.
Reference [42] proposed an FR IQA algorithm that first applies a set of lowpass filters and fan filters to the input images; this leads to thirty filtered versions with five spatial frequency bands and six orientations. In the next step, a modified Peli’s contrast is computed. A threshold elevation computation ensues, followed by a pooling stage that produces the perceptual error measure (PEM). The authors evaluate their approach using human opinion scores from a small-scale study and demonstrate that this measure does better than PSNR in terms of correlation with human perception.
Visual signal-to-noise ratio (VSNR) [43] aims at evaluating the effect of supra-threshold distortions using parameters for the HVS model derived from experiments where the stimulus was an actual image as against sinusoidal gratings or Gabor patches. First, a difference image from the reference and distorted images is computed and subjected to a discrete wavelet transform. Within each subband, the visibility of distortions is evaluated by comparing the contrast of the distortion to the detection threshold and then computing the root mean squared contrast of the error signal. Finally, using a strategy inspired from what is termed as global precedence in the HVS, a global precedence preserving contrast is computed. The final index is a linear combination of the error signal and contrast.
3.4.1.2 FR IQA: NSS-Based Approaches
Natural images (that is, any image that is not produced synthetically on a computer) follow certain statistical properties that do not vary with varying content. For example, the image of a mountain range and the close-up of a dog, both may exhibit the property that their power spectral density falls of as 1/fγ. Such content-independent statistical properties of natural scenes are referred to as natural scene statistics (NSS), and researchers have been trying to understand the relationship between the statistical properties of natural scenes and the properties of the human visual system [44]. The hypothesis is that since humans evolved in natural environments, the HVS is optimized to extract the statistical properties of natural scenes, and hence modeling scene statistics would give one insight into human visual processing. NSS-based QA algorithms utilize such NSS properties for quality assessment.
Single-scale structural similarity index (SS-SSIM)
For two image patches drawn from the same location of the reference and distorted images, that is, x = {xi|i = 1,2,...,N} and y = {yi|i = 1,2,...,N}, respectively, SS-SSIM evaluates luminance, contrast, and structure as follows [45]:
where C1, C2, and C3 (C3 = C2/2) are small constants included to prevent instabilities from arising when the denominator tends to zero. The terms µx, μy, , and σxy are the means of x and y, the variances of x and y, and the covariance between x and y, respectively, computed using a sliding window approach. The window that is commonly used is a 11 × 11 circular-symmetric Gaussian weighting function w = {wi|i = 1,2,...,N}, with standard deviation of 1.5 samples, normalized to sum to unity ().
Finally, the SSIM index between signal x and y is defined as:
The above computation produces a quality map of scores, which is spatially collapsed using the simple mean in order to produce a final quality measure for the image, although many other pooling strategies have been explored [8], [46], [47].
Multi-scale structural similarity index (MS-SSIM)
Since images are multi-scale and the human visual system processes visual information at multiple scales, Reference [48] proposed to evaluate image quality at multiple resolutions using the so-called multi-scale SSIM (MS-SSIM) index. This method performs quality assessment over multiple scales of the reference and distorted image patches (the signals defined as x and y in the previous discussion on SS-SSIM) by iteratively lowpass filtering and downsampling the signals by a factor of two. The original image scale is indexed as 1, the first down-sampled version is indexed as 2, and so on. The highest scale M is obtained after M − 1 iterations.
At each scale j, the contrast (Equation 3.4) and structure (Equation 3.5) comparison terms are calculated and denoted as cj (x,y) and sj (x,y), respectively. The luminance comparison (Equation 3.3) term is computed only at scale M and is denoted as lM(x, y). The overall SSIM evaluation is obtained by combining the measurement over scales:
The highest scale used here is M = 5. The exponents αj, βj, and γj are selected such that αj = βj = γj and . Variants of SSIM include SSIM computation in the complex-wavelet domain [49], [50], a gradient-based approach [51], and techniques based on pooling three perceptually important parameters [52], [53].
Visual information fidelity (VIF)
Reference [54] models wavelet coefficients, obtained from a subband decomposition of the reference and distorted images, using the Gaussian scale mixture (GSM) model [55] and utilizes the properties of natural scenes [56] in order to produce a quality measure. Each subband in the reference is modeled as C = S · U, where S is a random field (RF) of scalars and U is a Gaussian vector RF. The distortion model is D = GC + ν, where G is a scalar gain field and ν is additive Gaussian noise RF. It is assumed that the distorted and source images pass through the human visual system, and the HVS uncertainty is modeled as visual noise, that is, N and N′ for the source and distorted image, respectively, where N and N′ are zero-mean uncorrelated multivariate Gaussians. The method then computes E = C + N and F = D + N′ and evaluates the following criterion:
where I (X; Y|Z) is the conditional mutual information between X and Y, conditioned on Z. The term sj is a realization of Sj for a particular image, where j is the index that runs through all the subbands in the decomposed image.
Although VIF is directly based on NSS properties, it may not be clear to the reader why the SSIM indices are classified as NSS-based approaches. While an explanation is beyond the scope of this chapter, the reader is directed to Reference [57] for an analysis of the relationship between SSIM and VIF.
3.4.1.3 FR IQA: Feature-Based Approaches
Feature-based approaches for QA are generally based on extracting information relevant to the task of QA. Such feature extraction procedures seek inspiration from HVS properties and use certain heuristics while avoiding an explicit modeling of the HVS.
In Reference [58], the authors first compute the difference between the reference and distorted image, and then filter this difference using directional filters to form oriented edge images. A mask is applied to each of these oriented responses independently based on the activity measure and brightness. The resulting output is passed through a nonlinearity to obtain directional error, which is then pooled to produce a final error (quality) score.
In another work [59], the reference and distorted images are decomposed using the singular value decomposition (SVD), which is applied to 8 × 8 blocks. Distortion per block is computed as , where si and are the singular values for block i from the reference and test images. The final quality score is computed as M − SV D = ∑i∈all_blocks|Di − Dmid|, where Dmid represents the median of the block distortions. Even though the authors claim that the algorithm performs well, its relation to the HVS is unclear as is the significance of the SVD for IQA.
The IQA index proposed in Reference [60] uses the discrete wavelet transform to decompose the reference and test images. In each subband, mean surface curvature maps are obtained as follows:
where Iuu, Ivv, Iu, and Iv are the partial derivatives of the image I. The correlation coefficient between the curvatures of the original and distorted images is then evaluated. These correlation coefficients are then collapsed across the subbands to produce a quality score.
3.4.1.4 NR IQA: Distortion-Specific Algorithms
Having discussed FR algorithms, the focus is now shifted to no-reference (NR) QA algorithms. NR QA algorithms are broadly classified into those that are distortion specific and those that are distortion agnostic or holistic in nature. Distortion specific means that the algorithms can assess the quality of an image under the assumption that the image is affected by distortion X, where X could be JPEG compression, blur, and so on. Unlike this approach, which has been extensively studied, there exist just a few holistic QA algorithms, as discussed below.
JPEG IQA
Reference [61] proposed a blockiness measure for JPEG coded images under the assumption that although compression leads to multiple artifacts, blockiness is the most important attribute. To measure blockiness, a hermite transform-based approach is taken in which the one-dimensional (horizontal/vertical) blurred edges are modeled as a combination of the mean signal value, the step amplitude, blur parameters, and distance from the center of the window being used for computation. Once these properties are measured, simple statistics, such as the peak, mean, and standard deviation, are computed and evaluated for their performance. The authors also evaluate a Minkowski sum with various exponents to tune its performance relative to correlation with human perception.
Another work [62] proposed a JPEG QA algorithm that measures blocking and blurring due to JPEG compression and relates these measures to quality. The authors compute a horizontal first-order difference across the image and then estimate blockiness as the average difference across block boundaries. Further, activity is computed using two factors: the average absolute difference between in-block image samples and the zero crossing rate. These measures are combined using a nonlinear pooling strategy where the parameters are estimated using a training set. The authors report good performance on a relatively large database.
In Reference [63], the images are first converted from the RGB space to the perceptually relevant LMS color-space and analysis is performed on the achromatic component only. Neighboring differences in luminance along horizontal and vertical directions are computed and combined to produce a local blocking measure, which is pooled using a Minkowski summation to produce a final blocking measure. The authors also compute a blurring and ringing measure, using an importance map weighting spatial activity. A nonlinear pooling follows to produce an objective score.
In another work [64], edges are first classified as either block-boundaries or true edges using a threshold on the gradient value. The so-called plainness measure is then computed, which is a measure of the activity; this accounts for masking. Block artifact quality is then estimated by a combination of the gradient measure and the plainness measure.
Reference [65] proposed a visually significant blocking artifact metric (VSBAM), which decomposes a JPEG compressed image into a combination of primary edges, undistorted image edges, and blocking artifacts. In order to evaluate quality, the image is transformed into the Fourier domain along with the DC-only image, which is computed using local DCT. Vertical and horizontal blocking artifacts are then defined in the frequency domain using differences, and these are then transformed back to the spatial domain to produce a measure of quality.
JPEG2000 IQA
In Reference [66], the authors compute the gradient image and then obtain the direction of the gradient, followed by a Canny edge detector. For each edge pixel, a search is performed along the gradient direction as well as in the perpendicular direction to estimate the edge-spread at local extrema locations, which is a measure of blur. The average edge spread is then computed and pooled spatially to produce a measure of quality.
In Reference [67], the authors utilize a Canny edge detector to detect edges in an image and analyze the edge points using a window-based approach. In the training phase, these windowed edge points are computed for original images (S+) and distorted images (S−). A covariance matrix ∑ = (N− · ∑− + N+ · ∑+)/(N+ + N−) is then computed, where N+ and N− denote the number of windowed vectors in S+ and S−, respectively, whereas ∑+ and ∑− denote the covariance matrices for vectors in S+ and S−, respectively. Principal component analysis (PCA) is then performed on ∑, and the second and third principal components are used as axes for projection. During the testing phase, windowed vectors are projected onto these principal axes and the mean and variance of the distributions along these axes are computed. Finally, the distortion metric is pooled to produce a quality score, with parameters obtained from a training set.
A small subjective study for JPEG2000 IQA to produce mean opinion scores (MOS) was conducted in Reference [68]. The objective measure computes several features, namely, the standard deviation of luminance in a region around each pixel, the absolute difference of a central pixel from the second closest neighborhood pixel, and zero crossing in horizontal and vertical directions. These features are then combined using a nonlinear approach. The parameters of the model are trained and performance is demonstrated on various datasets, including the JPEG2000 portion of the LIVE IQA database [30].
A natural-scene statistics (NSS)-based approach to JPEG2000 quality assessment was proposed in Reference [69], where the measure of quality is evaluated in the wavelet domain. The authors exploited the dependency between a wavelet coefficient and its neighbors, and the fact that the presence of distortion will alter these dependencies. The dependencies are captured using a threshold and offset approach, where the parameters are estimated using a training set. Good performance of the presented approach was demonstrated on the LIVE IQA dataset.
Reference [70] presented an edge-based approach to blur quality assessment; and applied this approach to JPEG2000 compressed images. The measure is based on the number of edges found along a scanline as well as the blur width, which is measured using the local extrema around the detected edge point. A simple combination of these measures leads to a blur estimate, which can also be used as a measure of quality for JPEG2000 compressed images.
Sharpness/blur IQA
The authors of Reference [71] developed a sharpness measure based on the two-dimensional kurtosis of block DCT AC-coefficients. First, edge detection is performed, followed by thresholding, then the two-dimensional kurtosis of the DCT coefficients are computed over 8 × 8 blocks. The average kurtosis over the image forms a measure of sharpness.
In Reference [72], a Sobel filter is applied to compute the number of edge pixels and the gradient threshold. Then the gradient threshold is modified and the edge detection process is reapplied. This loop continues until the number of edge pixels becomes stable. Once the loop ends, the number of edge pixels found is compared to a parameter to check if the block is smooth or an edge block. For each edge block, contrast and edge width are estimated and a probability summation is used to collapse the contrast scores, which are finally subjected to a Minkowski summation to produce a sharpness metric.
In another work [73], the above algorithm is utilized with the addition of a saliency model. Specifically, once the amount of perceived blur is computed as in Reference [72], a saliency mask/weighting similar to that from Reference [74] is applied to the computed values to collapse the scores using a Minkowski summation.
Reference [75] proposed a measure that estimates the quality of image blur in the presence of noise using a gradient-based approach. Within a local window, the gradient covariance matrix is computed and is subjected to a singular value decomposition to estimate the local dominant orientation; the authors contend that the first two singular values are intimately related to sharpness. The final model for quality involves a contrast-gain-control mechanism using a combination of predetermined and estimated parameters.
A no-reference IQA algorithm, which measures image sharpness based on a cumulative probability of blur detection, was proposed in Reference [76]. Again, the algorithm follows an edge detection-based approach where blocks are categorized as smooth or non-smooth based on a predetermined threshold on the number of edge pixels. Once edge blocks are discovered, contrast computation follows. This is accompanied by a measure of edge width and a cumulative probability of edge detection, which is simply a summation over probabilities of detecting blur. The major difference here with respect to previous approaches [72], [73] is the absence of a Minkowski pooling stage at the end of the chain.
Reference [77] proposed a just-noticeable blur model that is an extension of the work in Reference [73], where the authors account for viewing distance as well, though the saliency model is dropped. Again, a variety of predetermined and computed thresholds are used to produce a quality score for the image, which is a Minkowski sum.
3.4.1.5 NR IQA: Holistic Algorithms
Reference [78] utilized a series of heuristic measures to quantify visual quality, which include edge sharpness, random noise level (impulse/additive white Gaussian noise), and structural noise. Edge detection is used to measure the sharpness of an edge, while impulse noise is measured using a local smoothness-based approach. A partial differential equation (PDE) model is used to measure Gaussian noise, whereas blocking and ringing artifacts from compression techniques such as JPEG and JPEG2000 are indicators of structural noise. While this work describes these measures to encompass a variety of distortions, it fails to propose a method to combine these measures to produce a quality assessment algorithm and fails to analyze the performance of the algorithm.
An interesting approach to the NR IQA problem was proposed in Reference [79], where a Renyi entropy measure along different orientations was used to measure anisotropy (that is, rotational asymmetry) and related the measured anisotropy to visual quality. The approach uses measure of mean, standard deviation, and range of the Renyi entropy along four orientations in the spatial domain. Although the authors demonstrate that their measure correlates with perceptual quality, a thorough performance evaluation is missing.
A different approach to blind IQA, which utilizes a two-stage framework that first identifies the proportion of each distortion present in the image and then performs distortion-specific quality assessment, was proposed in References [80] and [81]. This so-called distortion identification-based image verity and integrity evaluation (DIIVINE) index was shown to perform extremely well in terms of correlation with human perception on the LIVE IQA database [30], [81]. The DIIVINE index first decomposes an image using the wavelet transform and then performs the perceptually relevant step of divisive normalization. A series of statistical features, such as spatial correlation structure and across orientation correlation, are computed, and these features are then used to predict quality. The authors demonstrated that the DIIVINE approach is statistically equivalent in performance to the FR SSIM index and is statistically superior to the often-used PSNR, across all the distortions on the LIVE IQA database.
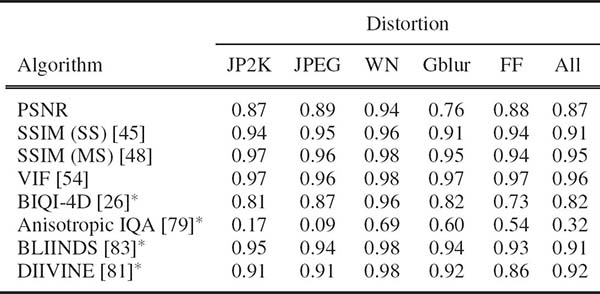
TABLE 3.2
Median Spearman’s rank ordered correlation coefficient across 1000 train-test trials on the LIVE image quality assessment database. Symbol * indicates NR IQA algorithms, others are FR IQA algorithms.
An alternate distortion-agnostic approach to blind IQA was proposed to compute statistical features in the DCT domain [82], [83]. This pragmatic approach, titled blind image integrity notator using DCT statistics (BLIINDS–II), extracts shape and variance from generalized Gaussian fits to DCT coefficients as well as energy ratios between frequency bands in the DCT. A small number of features are extracted at two scales in order to account for the multi-scale nature of both images and human visual perception; these statistical features are then regressed on to DMOS. As demonstrated on the LIVE IQA database, BLIINDS performs competitively with the FR SSIM index.
In order to provide the reader with a taste for how well some of the algorithms described here perform, Table 3.2 lists the median SROCC values across 1000 train-test trials on the LIVE IQA database [30]. Since NR algorithms considered here require training, partitioning the dataset is necessary to use the training images in order to set the parameters of the NR QA algorithm. In order to ensure performance across content, such an evaluation is repeated across multiple train-test iterations and the median value is reported. It is pertinent to note that the BLIINDS and DIIVINE NR models are competitive with the FR SSIM and beat the FR PSNR in terms of correlation with human perception.
3.4.2 Video Quality Assessment
Video quality assessment algorithms summarized in this section follow a similar taxonomy to IQA algorithms, as seen in Figure 3.7.
3.4.2.1 FR VQA: Models Based on the Human Visual System
Human visual system (HVS) based models for VQA generally follow a series of operations akin to that for IQA. Examples of such operations include linear decomposition, contrast sensitivity modeling, and so on, although the models take into account the temporal dimension of the video as well. Generally, the spatial contrast sensitivity function (CSF) is modeled using a lowpass filter (since the HVS is not as sensitive to higher frequencies), and the temporal CSF is modeled using bandpass filters. It is generally easier to model the spatial and temporal CSFs separately instead of modeling a spatiotemporal CSF [84]. A good overview of HVS-based models for IQA/VQA can be found in Reference [85].
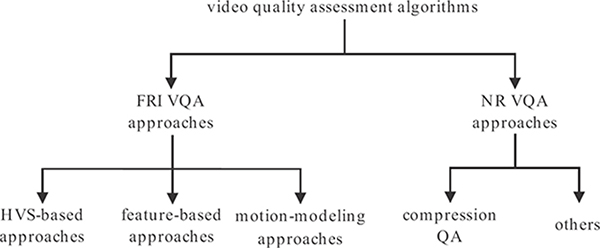
FIGURE 3.7
Taxonomy of video quality assessment algorithms summarized in this chapter.
The Sarnoff visual discrimination model (VDM) [86] was extended to the Sarnoff JND metric for video in Reference [87]. This approach applies a point-spread function (PSF) to the image, followed by a model of retinal cone-sampling, and then the image is decomposed using a Laplacian pyramid from which a contrast energy measure is computed. A masking procedure is then applied, and a JND distance measure is computed to produce a quality index.
Reference [88] proposed the digital video quality metric (DVQ), where quality is evaluated in the DCT-domain. The DVQ metric first transforms the image into the rarely used YOZ opponent color space [89], which is then decomposed using an 8 × 8 block DCT. The ratio of the AC amplitude to the DC amplitude is computed and labeled as local contrast, which is converted into JND units using thresholds derived from a human study, followed by contrast masking. The error scores between the reference and distorted frames are then computed using a Minkowski sum.
In Reference [90], a video is decomposed using Gabor filters for spatial decomposition and two temporal channels, which is followed by a spatiotemporal CSF. A simple intra-channel contrast masking is modeled as well. The moving picture quality metric (MPQM), as it is called, also segments the video into various regions, such as uniform areas, contours, and textures. The error scores from the decompositions between the reference and distorted videos for each of these regions are pooled separately to form a final error (quality) score.
Reference [91] applies a lowpass filter to a video, and this filtered version is subjected to a wavelet transform. A subset of the resulting coefficients are selected for distortion evaluation, which is computed using an error measure between the masked coefficients in the reference and distorted videos. The scalable wavelet-based distortion metric differs from other HVS-based approaches in that the parameters used for contrast masking and the contrast sensitivity function are derived from human responses to natural videos, as opposed to those derived from human responses to sinusoidal gratings.
3.4.2.2 FR VQA: Feature-Based Approaches
Feature-based approaches for VQA are similar to those for IQA, and generally extract features on a frame-by-frame basis. Some of these models incorporate motion information to model the temporal dimension of the video as well.
The perceptual video quality metric (PVQM) [92] extracts three features: edginess, a temporal indicator, and a chrominance indicator. Edginess is measured using the difference between the dilated edges of the reference and distorted frames computed using a local gradient measure, and reflects the loss in spatial detail. Temporal indicator is simply a measure of the correlation coefficient between adjacent frames, and the chrominance indicator is a function of the color saturation. Each of these three measures is pooled separately across the video and then combined to produce a quality measure.
The video quality metric (VQM) proposed in Reference [93] was one of the top performers in the video quality experts group (VQEG) phase-II studies [31] and has also been standardized by the American National Standards Institute; the International Telecommunications Union (ITU) has included VQM as a normative measure for digital cable television systems [94]. VQM extracts a series of features from the videos, including those that describe the loss of spatial detail, a shift in the orientation of the edges, the spread of chrominance components, and so on. Each of these features is thresholded and passed through nonlinearities, and the final quality score is a weighted sum of these values. VQM also includes elementary motion information in the form of the difference between frames and a quality improvement feature that accounts for improvements arising, for example, from sharpness operations.
Reference [95] proposed a measure of video quality that models the temporal variations in spatial distortions and relates such variations to visual quality. Temporal distortions, such as mosquito noise, flickering, and jerkiness, are modeled as an evolution of spatial distortions over time. A spatiotemporal tube, consisting of a spatiotemporal chunk of the video computed from motion vector information, is created, which is then evaluated for its spatial distortion. The spatial distortion is computed using the WQA quality index [96]. A temporal filtering of the spatial distortion is then undertaken, followed by a measurement of the temporal variation of the distortion. The quality scores are then pooled across the video to produce the final quality index.
The tetra video quality metric [97] is one of the few measure of video quality that utilize motion information. In this approach, motion estimates are determined using a block-based motion estimation algorithm, and such motion information from each heuristically determined shot [98] is utilized for temporal trajectory evaluation of the distorted video. This information is logged in a temporal information buffer, which is followed by a temporal visibility mask. Spatial distortion is evaluated by MSE. A spatiotemporal distortion map is then created, which is masked using a foveation model and temporal summation is then performed. The approach also accounts for the frame rate, frame pauses, and frame skips. All of the indicators are pooled to create a measure of quality.
3.4.2.3 FR VQA: Motion Modeling-Based Approaches
It should be clear from the above sections that while there exist many models for quality assessment of videos, most of these models are simply extensions of IQA algorithms that are applied on a frame-by-frame basis. Some of these models indeed utilize motion information, however, none of these models systematically investigate the effect that motion has on visual perception and how motion modeling may result in a better VQA algorithm. The reader will appreciate that simple spatial analysis of a video is insufficient to gauge the perceived spatiotemporal quality. In this section, two recent motion-modeling based approaches that seek to predict such spatiotemporal quality, are described.
Speed-weighted structural similarity index (SW-SSIM)
SW-SSIM is based on the notion that motion-based weighting of spatial scores obtained from the structural similarity index [45] is sufficient to model motion effects on visual quality [99]. In order to obtain this weighting scheme, the authors draw inspiration from human visual speed perception studies conducted by visual psychophysicists [100]. A histogram-based approach is used to identify the global motion vector for each frame, where the motion vector estimates are computed using the optical flow computation algorithm from Reference [101]. Relative motion is then extracted as the difference between the absolute motion vectors (computed from optical flow) and the global motion vectors. The weight for each pixel is a function of the relative motion, the global motion, and the stimulus contrast. Once such a weight map is obtained at each pixel location, the SSIM map applied on that frame is weighted by the computed speed-weight map. The weighted scores are then pooled across the video and normalized to produce a quality score for the video. The authors demonstrated that the approach well correlates with human visual perception.
Motion-based video integrity evaluation (MOVIE)
Although SW-SSIM uses motion information to weight SSIM scores, this kind of motion-based weighting of spatial quality may not suffice in successfully modeling the effect of spatiotemporal distortions on visual perception. To address this concern, Reference [102] introduced the MOVIE index, which is loosely based on models of motion perception in visual area MT of the primary visual cortex.
In the MOVIE approach, the reference and distorted videos are first decomposed using a multi-scale and multi-orientation spatiotemporal Gabor filter set, akin to what is hypothesized to occur in visual area V1 [103]. The MOVIE index is computed using two separate channels, one for spatial quality and the other for temporal quality, where the segregation of computation is inspired from the hypothesized spatiotemporal separability of the human visual system (HVS). Spatial quality is computed in much the same way as MS-SSIM. A modified version of the algorithm for optical flow [104] is used to compute motion estimates. Such optical flow computation is efficiently performed using the same set of Gabor filters that were used to decompose the videos. Temporal MOVIE is based on the principle that translational motion in the spatiotemporal domain manifests as a plane in the frequency domain [105] and that deviations from the reference motion will cause a shearing of this plane. Quantifying the shear leads to a measure of temporal quality. In order to do this, positive excitatory weights are assigned to the response of those filters which lie close to the spectral plane defined by the computed motion vectors and negative inhibitory weights to those filter responses which lie farther away from the spectral plane. Such weighting results in a strong response if the motion in the test and reference video coincide and a weak response is produced if the test video has motion deviant from that in the reference video. The mean-squared error between the responses from the test and reference filter banks then provides the temporal quality estimate. The final MOVIE index is the product of the spatial and temporal quality indices. The authors demonstrated that the MOVIE index performs extremely well in terms of correlation with human visual perception.
TABLE 3.3
FR algorithm performance on the LIVE VQA database [27] using Spearman’s rank ordered correlation coefficient.
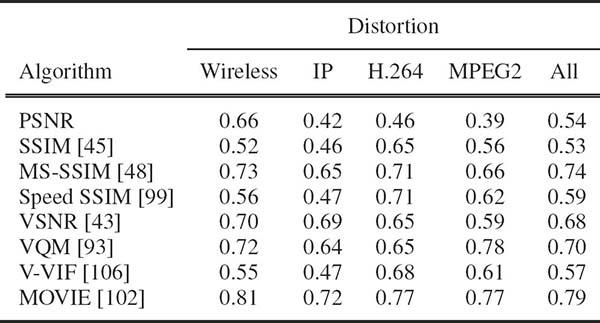
Having described a handful of FR VQA algorithms, Table 3.3 lists the value of Spearman’s rank ordered correlation coefficient (SROCC) of some of these approaches on the LIVE VQA database [27], to provide the reader with a sense of how well the various approaches predict visual quality. It should be noted that MOVIE is currently the best performer on the LIVE VQA database, as well as the VQEG phase-I dataset [29].
3.4.2.4 NR VQA: Compression
The majority of NR VQA algorithms in literature model quality due to compression artifacts and hence measure blockiness and bluriness. Some of these models also attempt to model temporal quality and chrominance artifacts. There exist no general-purpose NR VQA algorithms yet and hence this section describes algorithms that have specifically been designed for compression while those that serve various other purposes are described in the next section.
Blockiness-based techniques
Reference [107] uses a Sobel operator to compute the gradient of each frame which is then subjected to a Fourier transform. A harmonic analysis follows, in which the ratio of the sum of all harmonics to all AC components within a block is computed in both the horizontal and vertical directions. The variance of the empirical pdf obtained from the phase of the harmonics across frames is an indicator of blockiness. The authors demonstrated that their technique works well for both I- and P-frames in compressed video.
The method presented in Reference [108] creates a set of subsampled images from each frame, so that each subimage consists of a particular pixel from one of the 8 × 8 blocks used for MPEG compression, and correlates them to produce a blockiness measure for MPEG compressed SD videos. Reference [109] compared this measure with two other measures and concluded that this measure is a poor indicator of quality.
The perceptually significant block-edge impairment metric (PS-BIM) [110] computes horizontal and vertical block strengths as weighted sums of luminance differences in a frame, where the weights are derived from luminance masking effects. Although no subjective evaluation is conducted, the authors use I-frames from an encoded video to demonstrate performance.
Another gradient-based approach was proposed in Reference [111] where a normalized horizontal gradient is computed at each pixel as the ratio of the absolute gradient and the average gradient over a neighboring region in a frame. This normalized gradient is then summed across rows and the ratio of this sum at block boundaries (assuming a fixed block-size) to the sum at intermediate positions leads to a quality measure. The authors demonstrated in a small human study that this metric has good performance.
Multiple artifact measurement-based algorithms
The method presented in Reference [112] computes a series of measures, including measures of blocking, blur, and sharpness. Blocking is computed as weighted pixel differences between neighboring blocks, ringing artifacts are computed using an edge detection-based approach, and a kurtosis-based approach is used for evaluation of sharpness. The parameters for each of these measures are trained using a small set of training videos with subjective MOS. The authors demonstrated a high degree of correlation with human perception.
Reference [113] evaluates two measures of quality; one for blocking and the other for packet loss. In this approach, blockiness is a function of the variance of the block, while packet loss is quantified using a binary-edge image and row-differences for each of the encoded blocks. A comparison of the proposed metrics is performed with others known from the literature; however, this comparison does not involve any subjective correlations.
Reference [114] evaluates blockiness, blur, and noise in a similar way as Reference [112]. The method from Reference [108] is modified to measure blockiness. Edge-widths are used to measure blur, and variances of subblocks within an 8 × 8 block to measure noise. A weighted Minkowski pooling ensues and weights are estimated from human data. The algorithm is shown to perform well on a small database of human observations.
Another similar approach was proposed in Reference [115], which evaluated noise, blocking, moving artifacts, and color impariments in videos. The individual color channels are inspected and thresholded to form a color measure, while spatiotemporal regions are evaluated to study the effect of noise on quality. Although the authors demonstrated how these measures can be incorporated into a system, no such pooling was actually undertaken and no subjective evaluation was performed either.
Reference [116] presents a model for NR VQA consisting of frame quality measure and correction, asymmetric tracking, and mean value filtering. The frame quality measure is simply neighboring pixel differences with and without edge preservation filtering. This is subject to histogram calculations, pooling, and corrections to obtain the final measure. Asymmetric tracking accounts for the fact that humans tend to perceive poorer regions with greater severity than good ones [8]. Finally, mean value filtering removes high-frequency ingredients from the measure to produce the quality index. Evaluation on a small dataset shows good correlation with perception.
3.4.2.5 NR VQA: Other Techniques
An NR VQA that uses motion information was proposed in Reference [117]. This approach uses block-based motion estimates from a lowpass version of the distorted video along with luminance thresholds to identify translation regions of high spatial complexity. The sum of squared error between the block under consideration and its motion-compensated block in the previous frame is lowpass filtered to produce a spatial distortion measure. A temporal distortion measure is computed using a function of the mean of the motion vectors. Parameters and thresholds are trained using a part of the VQEG dataset [29] and when tested on the remaining part of the database, the approach demonstrates high correlation with human perception.
Reference [118] evaluated the blur caused due to video compression and imaging by first reducing the blocking artifacts by lowpass filtering. A subset of pixels from a frame are selected to evaluate blur due to compression (as opposed to intentional blur effects, such as those related to focus settings). Blur is then computed by quantifying edge-strength, which is shown to correlate well with PSNR for three videos.
Reference [119] proposed a measure for videos that have been subjected to frame-drops. The dropping severity is modeled as a function of the number frame drops using timestamp information from the video. The video is then segmented into cuts [98], and the motion activity of such a segment is determined using motion vector information and used to map the dropping severity to perceptual quality. A series of pooling steps, which include empirically determined thresholds and constants, follow, leading to a final quality score. The measure is shown to correlate well with human perception on a small dataset.
Channel-induced distortion for H.264/AVC compressed [120] videos is modeled in Reference [121], which attempts to estimate the MSE between the received and transmitted video using information from the macroblocks in the distorted video. The authors classify the macroblocks as either correctly received or lost. The lost macroblocks are modeled as a sum of distortions arising from motion vectors, prediction residuals, and distortion propagation. When the macroblocks are correctly received, the distortion is simply due to its propagation from the previous frame. Correlation between estimated channel distortion and measured channel distortion is used as a measure of performance.
Finally, Reference [122] modeled jerkiness between frames using absolute difference between adjacent frames and a threshold. Picture loss is similarly detected with another threshold. Blockiness is detected using a technique similar to those proposed previously. The test methodology is nonstandard and requires users to identify number of picture freezes, blocks, and picture losses in the videos; and perceptual quality is not evaluated.
3.5 Current and Future Research in Quality Assessment
Currently, FR IQA algorithms, such as the SSIM index, perform extremely well in terms of correlation with human perception, and although researchers have made attempts at bettering performance [8], [51], [123], the gains achieved have been minimal and statistically insignificant. Hence, it seems as if the field of two-dimensional IQA is currently at a plateau; that is, any additional gains that may be achieved will be at the cost of significant increase in processing that might not be justified by the end result. However, efficient implementation of IQA algorithms [124], [125] and use of quality indices as a criterion in the algorithm development [126], [127] remain exciting fields of research. Investigation of eye movements for the task of QA is another field that seemingly has great potential [8], [128], [129], [130], [131], [132], [133].
The field of NR IQA remains one of interest, since only recently distortion-agnostic approaches that perform competitively have been proposed [80], [82]. Development of efficient distortion-agnostic NR IQA algorithms that perform at least as well as leading FR IQA algorithms, such as MS-SSIM or VIF, are interesting avenues of future research. Further, evaluation of algorithm performance (of both FR and NR algorithms) on multiply-distorted images (for example, blur and compression) remains another interesting avenue of research [134], [135].
The field of FR VQA still has great potential for research, since the best algorithms do not correlate as well as the best IQA algorithms with human perception. As with FR IQA, efficient computation of FR VQA algorithms is an interesting direction of future research, especially when it comes to practical application of VQA algorithms [125]. Predicting visual attention in videos remains of interest, more so in VQA than IQA, since one would imagine that extracting low-level features from the reference video would make possible improved prediction of fixations and hence of quality. Further, the effect of distortions on visual attention is another ill-explored area of research [133].
As already discussed, existing NR VQA algorithms are generally geared toward compressed videos [110], [119], and a truly blind NR VQA algorithm that is distortion agnostic does not exist. Research on spatiotemporal perception and models for motion masking, such as the one used in Reference [27] and explored in Reference [136], may provide researchers with clues on how to model distortion-agnostic NR VQA algorithms. Temporal pooling of quality scores for VQA remains of interest and would complement existing literature on spatial pooling strategies for IQA [8], [46].
Apart from two-dimensional QA, stereoscopic or three-dimensional QA is an emerging research area [137], [138], [139], [140]. Device-specific QA remains of interest, as does utilization of QA algorithms for perceptual optimization for video delivery, video conferencing, and so on [141], [142], [143]. Studying visual aesthetics and context, as well as content-aware QA, is another interesting direction to pursue [144], [145], [146], [147], [148].
3.6 Conclusion
This chapter focused on perceptual quality evaluation of digital images and videos. Perceptual quality assessment is critical in the face of the explosion of media applications that are bringing digital images and video to people via the Internet, television, and cellular phones. The discussion started by focusing on perception of images and videos by humans and computational models of visual processing of these signals within the context of quality. Then, this chapter surveyed quality assessment algorithms that automatically predict the quality of a signal with or without the presence of a pristine reference based on perceptual models. It also discussed subjective methods to obtain ground truth data from human subjects on perceptual quality and presented comparative evaluations of different algorithms in matching visual perception. This was followed by discussing recent advances in the field of quality assessment and research directions in this field that remain open.
Although there exists tremendous scope for research in the area of QA, it is believed that a better understanding of human visual perception as well as better models of visual processing will tremendously benefit QA research. Researchers would do well to incorporate lessons learned from visual psychophysics in the development of visual quality assessment algorithms – for, after all, the ultimate receiver of the visual signal is the human observer!
References
[1] Cisco Corp., “Cisco visual networking index: Forecast and methodology, 2009-2014.” Available online, http://www.cisco.com/en/US/solutions/collateral/ns341/ns525/ns537/ns705/ns827/white paper c11-481360 ns827 Networking Solutions White Paper.html.
[2] Cisco Corp., “Cisco visual networking index: Global mobile data traffic forecast update, 2010–2015.” Available online, http://www.cisco.com/en/US/solutions/collateral/ns341/ns525/ns537/ns705/ns827/white paper c11-520862.html.
[3] B. Girod, “What’s wrong with mean-squared error?,” in Digital Images and Human Vision, A.B. Watson (ed.), Cambridge, MA, USA: MIT Press, 1993, pp. 207–220.
[4] Z. Wang and A.C. Bovik, “Mean squared error: Love it or leave it? – A new look at signal fidelity measures,” IEEE Signal Proceessing Magazine, vol. 26, no. 1, pp. 98–117, January 2009.
[5] O. Schwartz and E.P. Simoncelli, “Natural signal statistics and sensory gain control,” Nature Neuroscience, vol. 4, no. 8, pp. 819–825, August 2001.
[6] P.C. Teo and D.J. Heeger, “Perceptual image distortion,” in Proceedings of the IEEE International Conference on Image Processing, Austin, Texas, USA, November 1994, pp. 982–986.
[7] K. Seshadrinathan and A.C. Bovik, “Motion tuned spatio-temporal quality assessment of natural videos,” IEEE Transactions on Image Processing, vol. 19, no. 2, pp. 335–350, February 2010.
[8] A.K. Moorthy and A.C. Bovik, “Visual importance pooling for image quality assessment,” IEEE Journal on Selected Topics in Signal Processing, Special Issue on Visual Media Quality, vol. 3, no. 2, pp. 193–201, April 2009.
[9] O. Le Meur, P. Le Callet, D. Barba, and D. Thoreau, “A coherent computational approach to model bottom-up visual attention,” IEEE Transactions on Pattern Analysis and Machine Intelligence, vol. 28, no. 5, pp. 802–817, May 2006.
[10] F.L. Van Nes and M.A. Bouman, “Spatial modulation transfer in the human eye,” Journal of Optical Society of America, vol. 57, no. 3, pp. 401–406, March 1967.
[11] H.A.W. Schober and R. Hilz, “Contrast sensitivity of the human eye for square-wave gratings,” Journal of Optical Society of America, vol. 55, no. 9, pp. 1086–1090, September 1965.
[12] J.G. Robson, “Spatial and temporal contrast-sensitivity functions of the visual system,” Journal of Optical Society of America, vol. 56, no. 8, pp. 1141–1142, August 1966.
[13] J. Nachmias and R.V. Sansbury, “Grating contrast: Discrimination may be better than detection,” Vision Research, vol. 14, no. 10, pp. 1039–1042, October 1974.
[14] G.E. Legge and J.M. Foley, “Contrast masking in human vision,” Journal of Optical Society of America, vol. 70, no. 12, pp. 1458–1471, December 1980.
[15] J. Ross and H.D. Speed, “Contrast adaptation and contrast masking in human vision,” Proceedings of the Biological Society, vol. 245, no. 1315, pp. 61–70, October 1991.
[16] A.B. Watson Digital Images and Human Vision. Cambridge, MA, USA: MIT Press, 1993.
[17] J. Foley, “Human luminance pattern-vision mechanisms: Masking experiments require a new model,” Journal of Optical Society of America A, vol. 11, no. 6, pp. 1710–1719, June 1994.
[18] K. Seshadrinathan and A.C. Bovik, “Unifying analysis of full reference image quality assessment,” in Proceedings of the IEEE International Conference on Image Processing, San Diego, California, USA, October 2008, pp. 1200–1293.
[19] G.E. Legge, “Sustained and transient mechanisms in human vision: Temporal and spatial properties,” Vision Research, vol. 18, no. 1, pp. 69–81, January 1978.
[20] J.J. Kulikowski and D.J. Tolhurst, “Psychophysical evidence for sustained and transient detectors in human vision,” Journal of Physiology, vol. 232, no. 1, pp. 149–162, July 1973.
[21] B.A. Wandell, Foundations of Vision. Sunderland, MA, USA: Sinauer Associates Inc., 1995.
[22] J. Lubin, “The use of psychophysical data and models in the analysis of display system performance,” in Digital Images and Human Vision, A.B. Watson (ed.), Cambridge, MA, USA: MIT Press, 1993, pp. 163–178.
[23] Z. Wang, A.C. Bovik, H.R. Sheikh, and E.P. Simoncelli, “Image quality assessment: From error visibility to structural similarity,” IEEE Transactions on Image Processing, vol. 13, no. 4, pp. 600–612, April 2004.
[24] S. Daly, “The visible difference predictor: An algorithm for the assessment of image fidelity,” in Digital Images and Human Vision, A.B. Watson (ed.), Cambridge, MA, USA: MIT Press, 1993, pp. 176–206.
[25] International Telecommunication Union, “Methodology for the subjective assessment of the quality of television pictures,” Recommendation ITU-R BT.500-11, 2002.
[26] A.K. Moorthy, K. Seshadrinathan, R. Soundararajan, and A.C. Bovik, “Wireless video quality assessment: A study of subjective scores and objective algorithms,” IEEE Transactions on Circuits and Systems for Video Technology, vol. 20, no. 4, pp. 513–516, April 2010.
[27] K. Seshadrinathan, R. Soundararajan, A.C. Bovik, and L.K. Cormack, “Study of subjective and objective quality assessment of video,” IEEE Transactions on Image Processing, vol. 19, no. 6, pp. 1427–1441, June 2010.
[28] D. Sheskin, Handbook of Parametric and Nonparametric Statistical Procedures. Boca Raton, FL, USA: CRC Press, 2004.
[29] Video Quality Experts Group (VQEG), “Final report from the video quality experts group on the validation of objective quality metrics for video quality assessment phase I,” 2000. Available online, http://www.its.bldrdoc.gov/vqeg/projects/frtv-phase-i/frtv-phase-i.aspx.
[30] H.R. Sheikh, M.F. Sabir, and A.C. Bovik, “A statistical evaluation of recent full reference image quality assessment algorithms,” IEEE Transactions on Image Processing, vol. 15, no. 11, pp. 3440–3451, November 2006.
[31] Video Quality Experts Group (VQEG), “Final report from the video quality experts group on the validation of objective quality metrics for video quality assessment phase II,” 2003. Available online, http://www.its.bldrdoc.gov/vqeg/projects/frtv-phase-ii/frtv-phase-ii.aspx.
[32] D.M. Chandler and S.S. Hemami, “A57 database,” 2007. Available online, http://foulard.ece.cornell.edu/dmc27/vsnr/vsnr.html.
[33] “Toyama image database.” Available online, http://mict.eng.u-toyama.ac.jp/mict/index2.html.
[34] P. Le Callet and F. Autrusseau, “Subjective quality assessment irccyn/ivc database,” 2005. Available online, http://www.irccyn.ec-nantes.fr/ivcdb/.
[35] N. Ponomarenko, V. Lukin, A. Zelensky, K. Egiazarian, M. Carli, and F. Battisti, “TID2008 – a database for evaluation of full reference visual quality assessment metrics,” Advances of Modern Radioelectronics, vol. 10, pp. 30–45, 2009.
[36] E.C. Larson and D.M. Chandler, “Most apparent distortion: Full-reference image quality assessment and the role of strategy,” Journal of Electronic Imaging, vol. 19, no. 1, p. 0011006, January 2010.
[37] J.L. Mannos and D. Sakrison, “The effects of a visual fidelity criterion of the encoding of images,” IEEE Transactions on Information Theory, vol. 20, no. 4, pp. 525–536, April 1974.
[38] M. Eckert and A. Bradley, “Perceptual quality metrics applied to still image compression,” Signal Processing, vol. 70, no. 3, pp. 177–200, March 1998.
[39] S. Daly, “Visible differences predictor: An algorithm for the assessment of image fidelity,” Proceedings of SPIE, vol. 1666, p. 179-206, February 1992.
[40] A.B. Watson, “The cortex transform: Rapid computation of simulated neural images,” Computer Vision, Graphics, and Image Processing, vol. 39, no. 3, pp. 311–327, March 1987.
[41] A. Watson, “DCTune: A technique for visual optimization of DCT quantization matrices for individual images,” Society for Information Display International Symposium Digest of Technical Papers, vol. 24, pp. 946–946, 1993.
[42] S.J.P. Westen, R.L. Lagendijk, and J. Biemond, “Perceptual image quality based on a multiple channel HVS model,” in Proceedings of the IEEE International Conference on Acoustics, Speech and Signal Processing, Detroit, Michigan, USA, May 1995, pp. 2351–2354.
[43] D.M. Chandler and S.S. Hemami, “VSNR: A wavelet-based visual signal-to-noise ratio for natural images,” IEEE Transactions on Image Processing, vol. 16, no. 9, pp. 2284–2298, September 2007.
[44] A. Srivastava, A.B. Lee, E.P. Simoncelli, and S.C. Zhu, “On advances in statistical modeling of natural images,” Journal of Mathematical Imaging and Vision, vol. 18, no. 1, pp. 17–33, January 2003.
[45] Z. Wang, A.C. Bovik, H.R. Sheikh, and E.P. Simoncelli, “Image quality assessment: From error measurement to structural similarity,” IEEE Transactions on Image Processing, vol. 13, no. 5, pp. 600–612, April 2004.
[46] Z. Wang and X. Shang, “Spatial pooling strategies for perceptual image quality assessment,” in Proceedings of the IEEE International Conference on Image Processing, Atlanta, GA, USA, October 2006, pp. 2945–2948.
[47] A.K. Moorthy and A.C. Bovik, “Perceptually significant spatial pooling techniques for image quality assessment,” Proceedings of SPIE, vol. 7240, pp. 724012:1–11, January 2009.
[48] Z. Wang, E.P. Simoncelli, and A.C. Bovik, “Multi-scale structural similarity for image quality assessment,” in Proceedings of the IEEE Asilomar Conference on Signals, Systems, and Computers, Pacific Grove, CA, USA, November 2003, vol. 2, pp. 1398–1402.
[49] Z. Wang and E.P. Simoncelli, “Translation insensitive image similarity in complex wavelet domain,” in Proceedings of the IEEE International Conference on Acoustics, Speech, and Signal Processing, Philadelphia, PA, USA, March 2005, pp. 573–576.
[50] M.P. Sampat, Z. Wang, S. Gupta, A.C. Bovik, and M.K. Markey, “Complex wavelet structural similarity: A new image similarity index,” IEEE Transactions on Image Processing, vol. 18, no. 10, pp. 2385–2401, October 2009.
[51] G.H. Chen, C.L. Yang, and S.L. Xie, “Gradient-based structural similarity for image quality assessment,” in Proceedings of the IEEE International Conference on Image Processing, Atlanta, GA, USA, October 2006, pp. 2929–2932.
[52] Q. Li and Z. Wang, “Reduced-reference image quality assessment using divisive normalization-based image representation,” IEEE Journal of Selected Topics in Signal Processing, Special Issue on Visual Media Quality Assessment, vol. 3, no. 2, pp. 202–211, April 2009.
[53] X. Gao, T. Wang, and J. Li, “A content-based image quality metric,” Lecture Notes in Computer Science, vol. 3642, pp. 231–240, September 2005.
[54] H.R. Sheikh and A.C. Bovik, “Image information and visual quality,” IEEE Transactions on Image Processing, vol. 15, no. 2, pp. 430–444, February 2006.
[55] M.J. Wainwright and E.P. Simoncelli, “Scale mixtures of Gaussians and the statistics of natural images,” Advances in Neural Information Processing Systems, vol. 12, pp. 855–861, January 2000.
[56] E.P. Simoncelli and B.A. Olshausen, “Natural image statistics and neural representation,” Annual Review of Neuroscience, vol. 24, no. 1, pp. 1193–1216, 2001.
[57] K. Seshadrinathan and A.C. Bovik, “Unifying analysis of full reference image quality assessment,” in Proceedings of the IEEE International Conference on Image Processing, San Diego, CA, USA, October 2008, pp. 1200–1203.
[58] S. Karunasekera and N. Kingsbury, “A distortion measure for blocking artifacts in images based on human visual sensitivity,” IEEE Transactions on Image Processing, vol. 4, no. 6, pp. 713–724, June 1995.
[59] A. Shnayderman, A. Gusev, and A.M. Eskicioglu, “A multidimensional image quality measure using singular value decomposition,” Proceedings of SPIE, vol. 5294, pp. 82–92, January 2003.
[60] S. Yao, W. Lin, Z. Lu, E. Ong, M. Locke, and S. Wu, “Image quality measure using curvature similarity,” in Proceedings of the IEEE International Conference on Image Processing, San Antonio, TX, USA, September 2007, vol. 3, pp. 437–440.
[61] L. Meesters and J.B. Martens, “A single-ended blockiness measure for JPEG-coded images,” Signal Processing, vol. 82, no. 3, pp. 369–387, March 2002.
[62] Z. Wang, H.R. Sheikh, and A.C. Bovik, “No-reference perceptual quality assessment of JPEG compressed images,” in Proceedings of the IEEE International Conference on Image Processing, Rochester, NY, USA, September 2002, vol. 1, pp. 477–480.
[63] R. Barland and A. Saadane, “A reference free quality metric for compressed images,” in Proceedings of the International Workshop on Video Processing and Quality Metrics for Consumer Electronics, Sydney, Australia, August 2005, pp. 351–354.
[64] J. Chen, Y. Zhang, L. Liang, S. Ma, R. Wang, and W. Gao, “A no-reference blocking artifacts metric using selective gradient and plainness measures,” in Proceedings of the 9th Pacific Rim Conference on Multimedia: Advances in Multimedia Information Processing, Tainan, Taiwan, December 2008, pp. 894–897.
[65] S. Suthaharan, “No-reference visually significant blocking artifact metric for natural scene images,” Signal Processing, vol. 89, no. 8, pp. 1647–1652, August 2009.
[66] E. Ong, W. Lin, Z. Lu, S. Yao, X. Yang, and L. Jiang, “No-reference JPEG-2000 image quality metric,” in Proceedings of the IEEE International Conference on Multimedia and Expo, Baltimore, MD, USA, July 2003, pp. 6–9.
[67] H. Tong, M. Li, H.J. Zhang, and C. Zhang, “No-reference quality assessment for JPEG2000 compressed images,” in Proceedings of the IEEE International Conference of Image Processing, Singapore, October 2004, pp. 24–27.
[68] Z.M.P. Sazzad, Y. Kawayoke, and Y. Horita, “No reference image quality assessment for JPEG2000 based on spatial features,” Signal Processing: Image Communication, vol. 23, no. 4, pp. 257–268, April 2008.
[69] H.R. Sheikh, A.C. Bovik, and L.K. Cormack, “No-reference quality assessment using natural scene statistics: JPEG 2000,” IEEE Transactions on Image Processing, vol. 14, no. 11, pp. 1918–1927, November 2005.
[70] P. Marziliano, F. Dufaux, S. Winkler, and T. Ebrahimi, “Perceptual blur and ringing metrics: Application to JPEG2000,” Signal Processing: Image Communication, vol. 19, no. 2, pp. 163–172, February 2004.
[71] J. Caviedes and S. Gurbuz, “No-reference sharpness metric based on local edge kurtosis,” in Proceedings of the IEEE International Conference on Image Processing, Rochester, NY, USA, September 2002, pp. 53–56.
[72] S. Varadarajan and L. Karam, “An improved perception-based no-reference objective image sharpness metric using iterative edge refinement,” in Proceedings of the IEEE International Conference on Image Processing, San Diego, CA, USA, October 2008, pp. 401–404.
[73] N.G. Sadaka, L.J. Karam, R. Ferzli, and G.P. Abousleman, “A no-reference perceptual image sharpness metric based on saliency-weighted foveal pooling,” in Proceedings of the IEEE International Conference on Image Processing, San Diego, CA, USA, October 2008, pp. 369–372.
[74] L. Itti, C. Koch, and E. Niebur, “A model of saliency-based visual attention for rapid scene analysis,” IEEE Transactions on Pattern Analysis and Machine Intelligence, vol. 20, no. 11, pp. 1254–1259, November 2002.
[75] X. Zhu and P. Milanfar, “A no-reference sharpness metric sensitive to blur and noise,” in Proceedings of the International Workshop on Quality of Multimedia Experience, San Diego, CA, USA, July 2009, pp. 64–69.
[76] N. Narvekar and L. Karam, “A no-reference perceptual image sharpness metric based on a cumulative probability of blur detection,” in Proceedings of the International Workshop on Quality of Multimedia Experience, San Diego, CA, USA, July 2009, pp. 87–91.
[77] R. Ferzli and L. Karam, “A no-reference objective image sharpness metric based on the notion of just noticeable blur (JNB),” IEEE Transactions on Image Processing, vol. 18, no. 4, pp. 717–728, April 2009.
[78] X. Li, “Blind image quality assessment,” in Proceedings of the IEEE International Conference on Image Processing, Rochester, NY, USA, September 2002, pp. 449–452.
[79] S. Gabarda and G. Cristóbal, “Blind image quality assessment through anisotropy,” Journal of the Optical Society of America A, vol. 24, no. 12, pp. 42–51, December 2007.
[80] A.K. Moorthy and A.C. Bovik, “A two-step framework for constructing blind image quality indices,” IEEE Signal Processing Letters, vol. 17, no. 5, pp. 587–599, May 2010.
[81] A.K. Moorthy and A.C. Bovik, “Blind image quality assessment: From natural scene statistics to perceptual quality,” IEEE Transactions on Image Processing, to appear.
[82] M.A. Saad, A.C. Bovik, and C. Charrier, “A perceptual DCT statistics based blind image quality metric,” IEEE Signal Processing Letters, vol. 17, no. 6, pp. 583–586, June 2010.
[83] M.A. Saad, A.C. Bovik, and C. Charrier, “Model-based blind image quality assessment using natural DCT statistics,” IEEE Transactions on Image Processing, submitted.
[84] D.H. Kelly, “Spatiotemporal variation of chromatic and achromatic contrast thresholds,” Journal of the Optical Society of America, vol. 73, no. 6, pp. 742–750, June 1983.
[85] M. Nadenau, S. Winkler, D. Alleysson, and M. Kunt, “Human vision models for perceptually optimized image processing – a review,” Available online, http://citeseerx.ist.psu.edu/viewdoc/summary?doi=10.1.1.5.2376.
[86] J. Lubin, “A visual discrimination model for imaging system design and evaluation,” in Vision Models for Target Detection and Recognition: In Memory of Arthur Menendez, E. Peli (ed.), River Edge, NJ, USA: World Scientific Publishing, 1995, p. 245.
[87] J. Lubin and D. Fibush, “Sarnoff JND vision model,” T1A1, Technical Report T1A1, vol. 5, 1997, pp. 97–612.
[88] A.B. Watson, J. Hu, and J.F. McGowan III, “Digital video quality metric based on human vision,” Journal of Electronic Imaging, vol. 10, no. 1, pp. 20–29, January 2001.
[89] H.A. Peterson, A.J. Ahumada Jr., and A.B. Watson, “An improved detection model for DCT coefficient quantization,” Proceedings of SPIE, vol. 1913, pp. 191–201, February 1993.
[90] C. Van den Branden Lambrecht and O. Verscheure, “Perceptual quality measure using a spatiotemporal model of the human visual system,” Proceedings of SPIE, vol. 2668, pp. 450–461, January 1996.
[91] M. Masry, S.S. Hemami, and Y. Sermadevi, “A scalable wavelet-based video distortion metric and applications,” IEEE Transactions on Circuits and Systems for Video Technology, vol. 16, no. 2, pp. 260–273, February 2006.
[92] A. Hekstra, J. Beerends, D. Ledermann, F. De Caluwe, S. Kohler, R. Koenen, S. Rihs, M. Ehrsam, and D. Schlauss, “PVQM – a perceptual video quality measure,” Signal Processing: Image Communication, vol. 17, no. 10, pp. 781–798, October 2002.
[93] M.H. Pinson and S. Wolf, “A new standardized method for objectively measuring video quality,” IEEE Transactions on Broadcasting, vol. 50, no. 3, pp. 312–313, September 2004.
[94] International Telecommunications Union, “Objective perceptual video quality measurement techniques for digital cable television in the presence of a full reference,” ITU-T Recommendation 144, 2004.
[95] A. Ninassi, O.L. Meur, P.L. Callet, and D. Barba, “Considering temporal variations of spatial visual distortions in video quality assessment,” IEEE Journal on Selected Topics in Signal Processing, vol. 3, no. 2, pp. 253–265, April 2009.
[96] A. Ninassi, O. Le Meur, P. Le Callet, and D. Barba, “On the performance of human visual system based image quality assessment metric using wavelet domain,” Proceedings of SPIE, vol. 6806, pp. 680610:1–12, January 2008.
[97] M. Barkowsky, B.E.J. Bialkowski, R. Bitto, and A. Kaup, “Temporal trajectory aware video quality measure,” IEEE Journal on Selected Topics in Signal Processing, vol. 3, no. 2, pp. 266–279, April 2009.
[98] C. Cotsaces, N. Nikolaidis, and I. Pitas, “Video shot detection and condensed representation. A review,” IEEE Signal Processing Magazine, vol. 23, no. 2, pp. 28–37, March 2006.
[99] Z. Wang and Q. Li, “Video quality assessment using a statistical model of human visual speed perception,” Journal of Optical Society of America, vol. 24, no. 12, pp. B61–B69, December 2007.
[100] A.A. Stocker and E.P. Simoncelli, “Noise characteristics and prior expectations in human visual speed perception,” Nature Neuroscience, vol. 9, no. 4, pp. 578–585, April 2006.
[101] M.J. Black and P. Anandan, “The robust estimation of multiple motions: Parametric and piecewise-smooth flow fields,” Computer Vision and Image Understanding, vol. 63, no. 1, pp. 75–104, January 1996.
[102] K. Seshadrinathan, Video Quality Assessment Based on Motion Models. PhD thesis, The University of Texas at Austin, TX, USA, 2008.
[103] M. Carandini, J. Demb, V. Mante, D. Tolhurst, Y. Dan, B. Olshausen, J. Gallant, and N. Rust, “Do we know what the early visual system does?,” Journal of Neuroscience, vol. 25, no. 46, pp. 10577–10597, November 2005.
[104] D.J. Fleet and A.D. Jepson, “Computation of component image velocity from local phase information,” International Journal of Computer Vision, vol. 5, no. 1, pp. 77–104, January 1990.
[105] A.B. Watson and A.J. Ahumada, “Model of human visual-motion sensing,” Journal of the Optical Society of America A, vol. 2, no. 2, pp. 322–342, February 1985.
[106] H.R. Sheikh and A.C. Bovik, “A visual information fidelity approach to video quality assessment,” in Proceedings of the International Workshop on Video Processing and Quality Metrics for Conusmer Electronics, Scottsdale, AZ, USA, January 2005, pp. 23–25.
[107] K.T. Tan and M. Ghanbari, “Blockiness detection for MPEG2-coded video,” IEEE Signal Processing Letters, vol. 7, no. 8, pp. 213–215, August 2000.
[108] T. Vlachos, “Detection of blocking artifacts in compressed video,” Electronics Letters, vol. 36, no. 13, pp. 1106–1108, June 2000.
[109] S. Winkler, A. Sharma, and D. McNally, “Perceptual video quality and blockiness metrics for multimedia streaming applications,” in Proceedings of the International Symposium on Wireless Personal Multimedia Communications, Aalborg, Denmark, September 2001, pp. 553–556.
[110] S. Suthaharan, “Perceptual quality metric for digital video coding,” Electronics Letters, vol. 39, no. 5, pp. 431–433, March 2003.
[111] R. Muijs and I. Kirenko, “A no-reference blocking artifact measure for adaptive video processing,” in Proceedings of the European Signal Processing Conference, Antalya, Turkey, September 2005.
[112] J. Caviedes and F. Oberti, “No-reference quality metric for degraded and enhanced video,” Proceedings of SPIE, vol. 5150, pp. 621–632, July 2003.
[113] R. Babu, A. Bopardikar, A. Perkis, and O. Hillestad, “No-reference metrics for video streaming applications,” in Proceedings of the International Packet Video Workshop, Irvine, CA, USA, December 2004.
[114] M.C.Q. Farias and S.K. Mitra, “No-reference video quality metric based on artifact measurements,” in Proceedings of the IEEE International Conference on Image Processing, Genoa, Italy, September 2005, pp. 141–144.
[115] R. Dosselmann and X. Yang, “A prototype no-reference video quality system,” in Proceedings of the Canadian Conference on Computer and Robot Vision, Montreal, QC, Canada, May 2007, pp. 411–417.
[116] Y. Kawayoke and Y. Horita, “NR objective continuous video quality assessment model based on frame quality measure,” in Proceedings of the IEEE International Conference on Image Processing, San Diego, CA, USA, October 2008, pp. 385–388.
[117] F. Yang, S. Wan, Y. Chang, and H. Wu, “A novel objective no-reference metric for digital video quality assessment,” IEEE Signal Processing Letters, vol. 12, no. 10, pp. 685–688, October 2005.
[118] J. Lu, “Image analysis for video artifact estimation and measurement,” Proceedings of SPIE, vol. 4301, pp. 166–174, January 2001.
[119] K. Yang, C. Guest, K. El-Maleh, and P. Das, “Perceptual temporal quality metric for compressed video,” IEEE Transactions on Multimedia, vol. 9, no. 7, pp. 1528–1535, November 2007.
[120] I.E.G. Richardson, H.264 and MPEG-4 Video Compression: Video Coding for Next-generation Multimedia. Chichester, EK: John Wiley & Sons Inc., 2003.
[121] M. Naccari, M. Tagliasacchi, F. Pereira, and S. Tubaro, “No-reference modeling of the channel induced distortion at the decoder for H. 264/AVC video coding,” in Proceedings of the IEEE International Conference on Image Processing, San Diego, CA, USA, October 2008, pp. 2324–2327.
[122] E. Ong, S. Wu, M. Loke, S. Rahardja, J. Tay, C. Tan, and L. Huang, “Video quality monitoring of streamed videos,” in Proceedings of the IEEE International Conference on Acoustics, Speech and Signal Processing, Taipei, Taiwan, April 2009, pp. 1153–1156.
[123] C. Li and A.C. Bovik, “Three-component weighted structural similarity index,” Proceedings of SPIE, vol. 7242, pp. 72420Q, January 2009.
[124] D.M. Rouse and S.S. Hemami, “Understanding and simplifying the structural similarity metric,” in Proceedings of the IEEE International Conference on Image Processing, San Diego, CA, USA, October 2008, pp. 1188–1191.
[125] M.J. Chen and A.C. Bovik, “Fast structural similarity index algorithm,” in Proceedings of the IEEE International Conference on Acoustics Speech and Signal Processing, Dallas, TX, USA, March 2010, pp. 994–997.
[126] S.S. Channappayya, A.C. Bovik, and R.W. Heath, “A linear estimator optimized for the structural similarity index and its application to image denoising,” in Proceedings of the IEEE International Conference on Image Processing, Atlanta, GA, USA, October 2006, pp. 2637–2640.
[127] S. Channappayya, A.C. Bovik, C. Caramanis, and R.W. Heath, “Design of linear equalizers optimized for the structural similarity index,” IEEE Transactions on Image Processing, vol. 17, no. 6, pp. 857–872, June 2008.
[128] K. Miyata, M. Saito, N. Tsumura, H. Haneishi, and Y. Miyake, “Eye movement analysis and its application to evaluation of image quality,” in Proceedings of the IS&TSID Color Imaging Conference: Color Science, Systems and Applications, Scottsdale, AZ, USA, November 1997, pp. 116–119.
[129] P.L. Callet, S. Perchard, S. Tourancheau, A. Ninassi, and D. Barba, “Towards the next generation of video and image quality metrics: Impact of display, resolution, content and visual attention in subjective assessment,” in Proceedings of the Second International Workshop on Image Media Quality and its Applications, Chiba, Japan, March 2007, pp. 10–51.
[130] T. Vuori and M. Olkkonen, “The effect of image sharpness on quantitative eye movement data and on image quality evaluation while viewing natural images,” Proceedings of SPIE, vol. 6059, pp. 605903, January 2006.
[131] C.T. Vu, E.C. Larson, and D.M. Chandler, “Visual fixation patterns when judging image quality: Effects of distortion type, amount, and subject experience,” in Proceedings of the IEEE Southwest Symposium on Image Analysis and Interpretation, Santa Fe, NM, USA, March 2008, pp. 73–76.
[132] A. Ninassi, O. Le Meur, P. Le Callet, D. Barba, and A. Tirel, “Task impact on the visual attention in subjective image quality assessment,” in Proceedings of the European Signal Processing Conference, Florence, Italy, September 2006.
[133] A.K. Moorthy, W.S. Geisler, and A.C. Bovik, “Evaluating the task dependence on eye movements for compressed videos,” in Proceedings of the International Workshop on Video Processing and Quality Metrics for Consumer Electronics, Scottsdale, AZ, USA, January 2010.
[134] V. Kayargadde and J. Martens, “Perceptual characterization of images degraded by blur and noise: Model,” Journal of the Optical Society of America A, vol. 13, no. 6, pp. 1178–1188, June 1996.
[135] M. Farias, M. Moore, J. Foley, and S. Mitra, “Perceptual contributions of blocky, blurry, and fuzzy impairments to overall annoyance,” Proceedings of SPIE, vol. 5292, pp. 109–120, June 2004.
[136] M.A. Saad and A.C. Bovik, “Natural motion statistics for no-reference video quality assessment,” in Proceedings of the International Workshop on Quality of Multimedia Experience, San Diego, CA, USA, July 2009, pp. 163–167.
[137] Z.M.P. Sazzad, Y. Kawayoke, and Y. Horita, “Spatial features based no reference image quality assessment for JPEG2000,” in Proceedings of the IEEE International Conference on Image Processing, San Antonio, TX, USA, September 2007, pp. 517–520.
[138] P. Gorley and N. Holliman, “Stereoscopic image quality metrics and compression,” Proceedings of SPIE, vol. 6803, pp. 680305:1–12, January 2008.
[139] P. Campisi, P. Le Callet, and E. Marini, “Stereoscopic images quality assessment,” in Proceedings of the European Signal Processing Conference, Poznan, Poland, September 2007.
[140] P. Seuntiens, L.M.J. Meesters, and W. Ijsselsteijn, “Perceived quality of compressed stereoscopic images: Effects of symmetric and asymmetric JPEG coding and camera separation,” ACM Transactions on Applied Perception, vol. 3, no. 2, pp. 109–125, April 2006.
[141] H. Hoffmann, T. Itagaki, D. Wood, and A. Bock, “Studies on the bit rate requirements for a HDTV format with 1920 × 1080 pixel resolution, progressive scanning at 50 Hz frame rate targeting large flat panel displays,” IEEE Transactions on Broadcasting, vol. 52, no. 4, pp. 420–434, December 2006.
[142] J. Okamoto, K. Watanabe, A. Honda, M. Uchida, and S. Hangai, “HDTV objective video quality assessment method applying fuzzy measure,” in Proceedings of the International Workshop on Quality of Multimedia Experience, San Diego, CA, USA, July 2009, pp. 168–173.
[143] M.H. Pinson, S. Wolf, and G. Cermak, “HDTV subjective quality of H.264 vs. MPEG-2, with and without packet loss,” IEEE Transactions on Broadcasting, vol. 56, no. 1, pp. 86–91, March 2010.
[144] R. Datta, D. Joshi, J. Li, and J. Wang, “Studying aesthetics in photographic images using a computational approach,” Lecture Notes in Computer Science, vol. 3953, pp. 288–301, May 2006.
[145] Y. Ke, X. Tang, and F. Jing, “The design of high-level features for photo quality assessment,” in Proceedings of the IEEE Conference on Computer Vision and Pattern Recognition, New York, USA, June 2006, pp. 419–426.
[146] C. Li and T. Chen, “Aesthetic visual quality assessment of paintings,” IEEE Journal of Selected Topics in Signal Processing, Special Issue on Visual Media Quality, vol. 3, no. 2, pp. 236–252, April 2009.
[147] Y. Luo and X. Tang, “Photo and video quality evaluation: Focusing on the subject,” in Proceedings of the European Conference on Computer Vision, Marseille, France, October 2008, pp. 386–399.
[148] A.K. Moorthy and A.C. Bovik, “Statistics of natural image distortions,” in Proceedings of the IEEE International Conference on Acoustics Speech and Signal Processing, Dallas, TX, USA, March 2010, pp. 962–965.