
4
Visual Aesthetic Quality Assessment of Digital Images
Congcong Li and Tsuhan Chen
4.2 Database, Human Study, and System Design
4.2.1 Database and Human Study
4.3 Computational Features for Visual Aesthetics
4.3.1.1 Color-Related Features
4.3.1.2 Illumination-Related Features
4.3.1.3 Spatial Composition-Related Features
4.3.1.4 Depth-Related Features
4.3.1.5 Main Subject-Related Features
4.4 Learning Models for Aesthetic Quality Assessment
4.5.1 Aesthetics Assisted Web Search
4.5.2 Automatic Photo Enhancement
4.5.3 Photo Selection and Album Management
4.1 Introduction
Visual aesthetic quality is a measure of visually perceived beauty. Judgment of the visual aesthetic quality of images is highly subjective, involving sentiments and personal taste [1]. However, some images are often believed, by consensus, to be visually more appealing than others. This serves as one of the principles in the emerging research area of computational aesthetics. Computational aesthetics is concerned with exploring computational techniques to predict emotional response to a visual stimulus, and developing methods to create and enhance pleasing impressions [2], [3]. This chapter focuses on exploring computational solutions to automatically infer the aesthetic quality of images. The greatest challenge in this research lies in the gap between low-level image properties and the high-level human perception of aesthetics.

FIGURE 4.1 (See color insert.)
Images with different aesthetic qualities. Images on the first row are taken by professional photographers while images on the second row are taken by amateur photographers.
This chapter starts by defining the problem of interest and giving a brief review of related works. After the introduction, Section 4.2 discusses some key aspects of the problem, including database and human judgments, and introduces the general flow of a computational solution for learning the image aesthetics. Section 4.3 introduces the principles and approaches being employed to extract computational features for representing the aesthetic quality. After analyzing the feature extraction, Section 4.4 explores different learning models that can be utilized for mapping from the computational features to the perceived aesthetics. Section 4.5 provides some examples among the large amount of applications for which the aesthetic quality assessment technique is highly desirable. Finally, this chapter concludes with Section 4.6.
4.1.1 Visual Aesthetics
The Oxford Advanced Learners Dictionary defines aesthetics as “concerned with beauty and art and the understanding of beautiful things, and made in an artistic way and beautiful to look at” [4]. Generally speaking, visual aesthetics is a measure of the perceived beauty of a visual stimulus. The visual aesthetic quality of an image measures how visually appealing the image is in people’s eyes. As shown in Figure 4.1, different images arouse different emotional responses in people. Some images give the viewer more pleasing impressions than other images.
Unlike measuring the visual quality, that is, evaluating the level of image degradation, the aesthetic quality of an image is more related to its semantic content [5]. Given the abstract and subjective properties of aesthetics, it is unclear even for the professional photographers which characteristics are more correlated with the aesthetic quality of an image. However, professional photographers have summarized some general rules and techniques to guide the adjustment of color, composition, depth, and so on.
Psychologists and photography researchers have tried to explore how humans judge visual aesthetics. From studies in neuroscience, Reference [6] suggests that there is not one aesthetic sense only but many senses, each tied to a different specialized processing system. Different artistic attributes excite different groups of cells in the brain, so there is also a functional specialization in aesthetics. Reference [2] summarizes the basic dimensions of visual aesthetics, called aesthetic primitives, as the different modularities of the human visual system, and points out the most important modularities are color, form, spatial organization, motion, depth, and the human body. There are also studies that focus on how some of these characteristics affects image aesthetics. For example, the role of color preferences has been studied [7], [8], [9], and the role of the spatial composition has been analyzed [10], [11]. In previous works on computational aesthetics, psychology and photography have been important sources that inspire the design of computational features. More analysis on the aesthetic characteristics will be given in Section 4.3.
What is visual aesthetic quality assessment of images? The goal of image aesthetic quality assessment is to have an automatic computational algorithm provide images aesthetics scores that are consistent with human consensus. As will be discussed, to simplify the task, in some cases the algorithm only needs to predict the aesthetics labels for the images, indicating whether they belong to the high-quality class or low-quality class. The aesthetic quality assessment technique is highly useful in many applications, such as image search, photo enhancement, photo management, photography, and so on.
4.1.2 Related Works
Recent years have shown rapidly increasing interest in how to computationally predict the aesthetic quality of images. Assessing the aesthetic quality of images is a highly subjective task. Although it has long been studied in photography and visual psychology [6], [7], [12], [13], [14], [15], and many guidelines have been provided, there are no fixed rules that can directly connect the image content with the perceived aesthetics. Recent works seeking for computational solutions address the challenge of automatically predicting image aesthetic quality using their visual content as a machine learning problem. Generally, these techniques first extract computational features from the images and then learn the mappings from the features to the human-rated aesthetic quality through learning techniques.
One of the earliest attempts in this direction was made in Reference [16], which aimed at classifying photos as professional or amateur. Without analyzing how the semantic content in the image relates to the two quality classes, a large group of low-level features was collected and used to train standard learning algorithms for the classification. However, this black-box approach did not provide insight on how to design better features to represent the image appeals. Recent research studies in this area have focused on designing features to represent some high-level concepts that are highly correlated to the image aesthetics [4], [17]. The intuition of feature extraction often comes from concepts in psychology, photography, or human studies. For example, Reference [17] extracted low-level features, such as average hue and edge distribution, to represent the high-level properties, like color preferences or simplicity. Similarly, Reference [4] extracted another group of visual features to represent different characteristics related to the image’s composition, object shape, color, and so on. These ideas were further extended in Reference [18] which proposed features related to the subject region of the image that is assumed to receive more attentions from the viewer and is thus more relevant to the aesthetic quality. Addressing digital images of paintings, Reference [19] introduced a set of features motivated from psychology, art, and controlled human study, to predict common people’s aesthetics judgment toward different impressionistic paintings. Many efforts have also been made to study features specifically to assess the aesthetic quality of consumer photographs [20], [21], [22], [23], [24].
In Reference [25], the authors proposed adding the high-level describable image attributes instead of using only the low-level features to represent the image appeal. Existing algorithms were utilized to extract high-level attributes, such as the presence of salient objects, the presence of faces, and the scene category to which the respective image belongs. The significant improvement in performance demonstrates the power of utilizing high-level semantic attributes. The more the content and structure of the image is understood, the better performance can be achieved in the quality prediction. Therefore, the present work also encourages closer collaboration between aesthetic quality assessment with other areas that are dedicated to the holistic scene understanding.
Many applications based on the assessment have been developed, such as aesthetics-assisted image search [17], [24], automatic photo enhancement [26], [27], [28], [29], [30], and album management [20], [28], [31]. There have been also works that extend the aesthetic quality assessment techniques from images to videos [18], [32]. However, the automatic aesthetics assessment itself is still far from being solved. Section 4.2 discusses the challenges in data collection and human study, and introduces the general techniques used for aesthetics assessment.
4.2 Database, Human Study, and System Design
4.2.1 Database and Human Study
The subjectivity in predicting aesthetics raises a critical issue: what data should be used to study image aesthetics? In order to train and evaluate any computational algorithms, a database of images with aesthetic ratings based on human’s judgments is needed. Unlike other research areas in computer vision, such as scene recognition and object detection, where standard datasets are available for evaluation, no benchmark database has been explicitly created for aesthetic quality assessment. Constructing such a database with manual aesthetic labels is challenging. Ideally, the database needs to be a large-scale collection of photos coming from a diverse group of photographers, including amateurs and professionals, and representing different contents and styles, from portrait to scenery, from abstract to realistic, and so on. Moreover, a large-scale human study is needed in order to reach any consensus in the aesthetic scores/labels given to an image. Participants in the study should be chosen based on the definition of aesthetics. For example, if the goal is to understand aesthetics in the eyes of photographers, a study should be conducted among a large group of photographers. However, if the goal is to study aesthetics in the eyes of common people who are non-experts in photography, the diversity in the demography of the participants has to be increased. The human study also needs to be well controlled in terms of participant constitution, viewing conditions, the viewing time, monitor screen resolutions, and other factors. Although crowdsourcing Internet marketplaces, such as Amazon Mechanical Turk,1 have been widely utilized to quickly collect labels for other computational vision tasks [33], using such services to help build a dataset for aesthetics would pose further challenges in the design of a human study due to the uncontrolled noisy feedbacks. Although there have not been standard datasets in image aesthetics, researchers have made alternative efforts to push forward the research in this area.
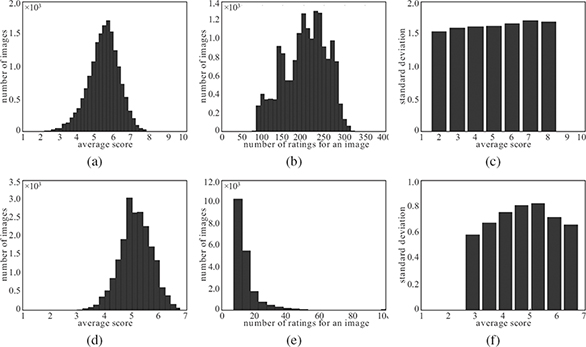
FIGURE 4.2
Statistic analysis on two large subsets [34] from two photo sharing websites: (a–c) DPChallenge.com and (d–f) Photo.net.
Given the fact that a larger-scale dataset is more difficult for a controlled human study, prior works have started by creating datasets that contain a certain group of images. For example, Reference [35] presented a dataset with consumer photos (that is, non-professional photos) and aesthetic labels collected through a well-controlled human study. Reference [22] introduced a dataset of consumer photos containing human faces and the corresponding aesthetic labels collected through a human study via Amazon mechanical turk, with delicate designs to ensure that the participants used consistent standards to assess the images across the whole survey. Studying photos of paintings, an offline rating survey was conducted to collect the participants’ general ideas about factors affecting the painting aesthetics and the aesthetic scores for all images [19]. However, these existing datasets are either not large enough or are not yet publicly available.
Another option is to use images from popular photo-sharing websites, such as DPChallenge2 and Photo.net3 [4], [17], [18]. The former one allows users to participate in theme-based photography contests, in which winners are determined based on the peer ratings of overall quality on a one to ten scale. The latter one serves as a platform for photography enthusiasts to post their shots, which are peer rated on a one to seven scale in terms of the aesthetic quality. Some other websites also provide measures related to the photo’s aesthetic quality. For example, Flickr4 provides a measure called “interestingness,” which is computed through analysis of social interactions (such as viewing patterns, popularity of the content owner, favoring behavior, and so on) with that photo. The originality scores for images are highly correlated with the aesthetics scores given the photos on the Photo.net website [4]. All of these datasets have the advantage of containing large-scale data. However, there is not much control in the rating conditions, which results in biased ratings under certain circumstances. Moreover, the diversity of the rating participants is limited; many of the ratings are given by professional photographers instead of the general community. To mitigate this problem, Reference [34] used large subsets from three web-based sources (Photo.net, DPChallenge, and Terragalleria5) and reported the nature of user ratings on each dataset.
Here, the samples from Reference [34] are utilized and some statistical results are generated for the subsets from DPChallenge and Photo.net. Namely, Figures 4.2a and 4.2d show the distributions of the average scores in the respective dataset, Figures 4.2b and 4.2e show the distributions of number of ratings received by an image in the respective dataset, and Figures 4.2c and 4.2f show the standard deviation of the user scores corresponding to different average scores. Note that for Photo.net, scores are concentrated in the high end, perhaps because people are more likely to rate high-quality photos without specific instructions. Moreover, most images in the Photo.net subset received fewer than 20 ratings, while images in DPChallenge receive a larger amount of ratings. In Figures 4.2c and 4.2f, the variance provides some idea about the consensus of the ratings. The ratings in DPChallenge are less consistent than those in Photo.net. Another interesting result in the variance trend for Photo.net is that the photos with average scores at the two extreme ends (extremely low/high) received better consensus. This result is consistent with what has been found in controlled user studies in References [21] and [22].
4.2.2 System Design
This section introduces the general flow for designing a visual aesthetic quality assessment system, which is adopted by most of the current aesthetics assessment algorithms. As shown in Figure 4.3, building such a system comprises two parts: conducting a human study to collect human ratings and developing the computational algorithms. Note that the voting and rating activities on those photo-sharing websites mentioned earlier are generally considered as human studies.
5http://www.terragalleria.com/
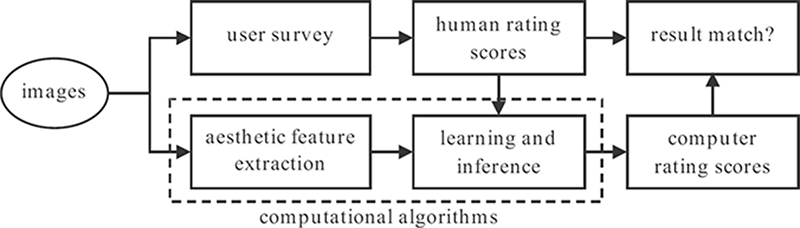
FIGURE 4.3
The general flow used for design an aesthetic visual quality assessment system.
The human ratings gained from the study are used to generate ground-truth labels, which are important inputs to the computational algorithms. In general, previous works have used the average score of the human ratings given to an image as the ground-truth aesthetic score for the image. For the computational part, a series of features representing various characteristics of the image appeal are extracted, followed by a regression or classification algorithm to map the extracted features to the ground-truth aesthetic scores. The system first extracts features from the test image, and then uses the corresponding inference algorithm to predict the aesthetic score. The performance of such a system is evaluated by measuring how well the predicted scores match with the average human-rated scores. In this chapter, Section 4.3 details how to extract effective computational features to represent the image aesthetic appeal, whereas Section 4.4 describes how to make use of a learning algorithm to predict the image aesthetics.
4.3 Computational Features for Visual Aesthetics
Extracting computational features to represent the image appeal is a crucial part of the aesthetic quality assessment task. Previous works have designed such features mainly by using human intuition, conducting human studies, and gaining inspirations from photography or psychology literatures. Reference [2] analyzed the modularities of the human visual system and derived the six basic dimensions of visual aesthetics called aesthetic primitives: color, form, spatial organization, motion, depth, and human body. Reference [17] found three distinguishing factors that affect the image appeals: simplicity, realism, and basic photographic techniques. Similarly, using questionnaires, Reference [19] found that color, composition, meaning, texture, and shape are the most frequently mentioned factors that affect judgment of aesthetic quality. Besides considering the global image characteristics, Reference [18] emphasized the importance of the main subject in an image on the aesthetic quality and summarized findings presented in References [13], [14], and [36]. According to those findings, “high quality photos generally satisfy these three principles: a clear topic, gathering most attention on the subject, and removing objects that distract attention from the subject.” Thus, Reference [18] considered four criteria related to the different treatment of the subject and background: composition, lighting, focus controlling, and color.
TABLE 4.1
Summary of the low-level features introduced in Section 4.3.1, which are divided into five groups according to the characteristics which the respective features represent.
Color Statistics |
Golden-Section Rule (Rule of Thirds) |
color distribution |
visual balance |
color simplicity |
shapes |
color harmony |
texture and pattern |
Illumination |
Depth |
Main Subject Region |
average lightness lightness contrast |
linear perspective sharpness-blurring distributions |
subject colorfulness background simplicity subject spatial composition subject-background contrasts face-related characteristics |
Based on the analysis of criteria used for assessing the image aesthetics, various algorithms, such as those presented in References [4], [17], [18], and [19], have been proposed to extract low-level image features related to the criteria. Some recent works [22], [25] also proposed higher-level semantic attributes to describe the image appeal. The following sections will analyze the low-level features and high-level attributes.
4.3.1 Low-Level Features
This section introduces features that have been popularly used in previous works on aesthetic quality assessment. Depending on their representing characteristics, the features can be mainly divided into the following groups: color-related features, illumination-related features, spatial composition-related features, depth-related features, and main subject-related features, as summarized in Table 4.1. However, features in different groups are not completely independent. Instead, they can be related and contain overlapping information.
4.3.1.1 Color-Related Features
Color is probably the most direct information that can be catched from an image, even before its close inspection. Creating more appealing color composition is an important artifice for a professional photographer.
Color statistics
A rough measure of an image’s color characteristics is to calculate the mean value of the pixel colors across the image. From the artistic aspect, the average color more or less represents the color keynote of the image. Assuming the RGB representation, the mean value can be computed for each of the three channels. In the case of the HSV representation, similar operations can be used to get the mean for the S and V channels, but not for the H channel. Consider the two hue values h1 and h2 shown in Figure 4.4a. Though their perceived colors are close to each other, the average of these two hue values is h* = (h1 + h2)/2 = 0.5, which is not even close to either of these two hue values. To avoid this problem, the vector representation for the hue value should be used, as shown in Figure 4.4b. The average hue vector can be defined as , where the normalization is operated because only the direction of the resulted vector matters. The scalar h* can be obtained by converting back to the scalar representation.
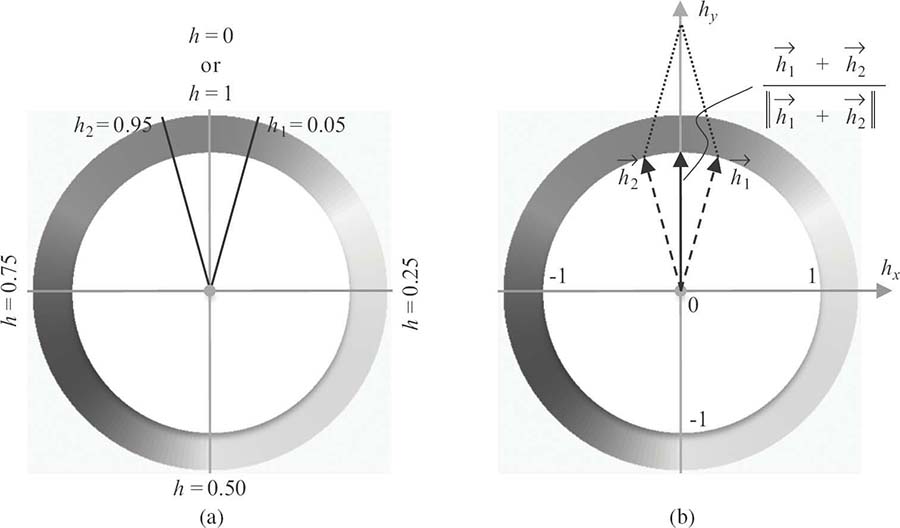
FIGURE 4.4 (See color insert.)
Different representations of the hue values: (a) scalar representation and (b) vector representation.
Color distribution
Prior works used a three-dimensional histogram with each axis corresponding to a color channel, or considered the histogram for the different channels individually. The histograms can be generated based on all the pixels in the image to represent the global color composition of the image, or based on the pixels within a presegmented region to represent local color composition.
Hue count
The hue count of an image is a measure of the image’s simplicity [17]. Most professional photos are often so simple that the main focusing objects can easily stand out of the background, while amateurish photos often seem cluttered due to the improper mixture of the different colors from different objects. The hue count of an image is calculated as follows. First, color images are converted to the HSV space. Second, only pixels with brightness values in the range [0.15,0.95] and saturation larger than 0.2 are considered. This is because a pixel not satisfying these requirements looks close to gray color no matter what hue value it has. Third, a K-bin histogram is computed on the hue values of the requirement-satisfied pixels. The hue count is the number of bins with values larger than a certain threshold t, that is,
where ‖ · ‖ indicates the number of elements in a set.
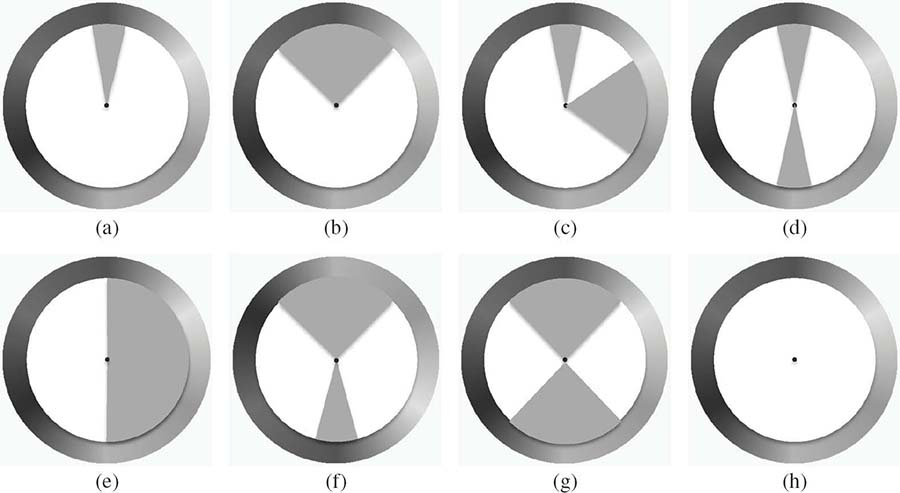
FIGURE 4.5 (See color insert.)
Harmony hue distribution models with gray indicating the efficient regions: (a) i type, (b) V type, (c) L type, (d) I type, (e) T type, (f) Y type, (g) X type, and (h) N type. All the models can be rotated by an arbitrary angle.
Color harmony
Harmony in color is an important factor that affects the image appeal. Some patterns, such as combining complementary colors or using only neighboring colors, may bring better harmony than other randomly spread color patterns. Previous works [19], [26], [37] utilized the models from Reference [38] to evaluate the extent of color harmony in an image. This prior work studied various color schemes that were adopted as print clothes and dresses for girl students, and classified them into some groups, respectively, for the hue distribution and the tone-lightness distribution. As an example, Figure 4.5 shows the eight hue distribution models. In this figure, the type-N model corresponds to gray-scale images while the other seven models, each of which consists of one or two sectors, are related to color images. Gray regions indicate that the respective model prefers the pixel hues to agglomerate within the specific regions. Since all the models can be rotated by an arbitrary angle, what they are measuring is the relative relationship of the hues in the image rather than the specific color distribution modeled by the hue histogram itself. Figure 4.6 gives three example images that fit well with different types of harmony models.
As discussed in Reference [26], the set of hue distribution models can be used to evaluate the color harmony. Given an image, each of these models can be fit to the hue histogram of the image. Let Tk(α) be defined as the kth hue model rotated by an angle α and ETk (α) (p) as the hue in the model Tk(α) that is closest to the hue of the pth pixel h(p); that is,
where Gk is the gray region of model Tk(α) and Bnearest is the hue of the sector border in model Tk(α) that is closest to the hue of pixel p. Further, let the distance between the hue histogram and the kth model rotated by a be defined as follows:

FIGURE 4.6 (See color insert.)
Image examples that fit with different types of hue harmony models in Figure 4.5: (a) fitting I-type harmony, (b) fitting Y-type harmony, and (c) fitting i-type harmony.
where ‖ · ‖ refers to the arc-length distance on the hue wheel and s(p) is the saturation of pixel p, which appears here as a weight since the difference between colors with low saturation is perceptually less noticeable. Now, in order to fit the kth model with the current image, it is necessary to look for the best rotation angle that minimizes Fk, α as
The above operations is repeated for all harmony models to find out how each of them fits with the image; the procedure forms a set of harmony scores , for k = 1,2,...,K. These harmony scores can be directly used as the hue harmony features for the image, or summarized to other features, such as choosing the minimal score to indicate how harmonious the image is (as in Reference [26]) or forming a K-dimension binary feature to indicate which harmony model fits the image best (as in Reference [19]). Besides using the models from Reference [38], some other methods also proposed to measure color harmony in an image [18].
4.3.1.2 Illumination-Related Features
Choosing proper lighting conditions for capturing photo and controlling the exposure are basic techniques for professional photographers. Professional photographers also make good use of the lighting contrast to emphasize the main objects on which they expect the audience to focus. Therefore, the lighting effects on an image are important measures for its appeal.
Average lightness
Considering the HSV color representation, the arithmetic average lightness value of an image can be computed. Another way to measure the average lightness of an image is to compute the logarithmic average lightness, that is, , where ν(p) is the lightness value of the pixel p, the term Np denotes the number of pixels in the image, and ε is a small number to prevent from computing log(0). The logarithmic average can provide some complementary information about the dynamic range of the lighting in the image. For example, two images with the same arithmetic average lightness can have very different logarithmic average lightness, due to their different dynamic ranges.
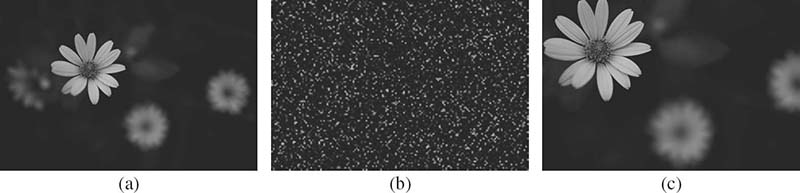
FIGURE 4.7
The effects of different spatial compositions: (a) original professional photograph, (b) image created by shuffling the pixels in (a), and (c) image created by changing the spatial composition in (a).
Lightness contrast
Human color vision relies on both hue and lightness [39]. Without hue contrast, it would be difficult for human eyes to recognize different objects; without lightness contrast, it would be difficult for human eyes to decide the exact place for something. Looking at an image with flat lightness over it, human eyes cannot easily figure out a proper point to focus on. However, this does not mean that low lightness contrast definitely decreases the aesthetics of an image. An overexposed or underexposed photograph under certain scenarios may yield very original and beautiful shots. In artistic creation, low luminance contrast may create an illusion of vision [39]. This suggests that the lightness contrast is an important feature related to the image appeals although the preference of high contrast or low contrast is data dependent. One way to measure the lightness contrast is as follows. Consider the HSV color representation of the image, with Hv being the histogram of the lightness values of the pixels. The histogram is used to search for the minimal region [bl,br] that centralizes 98% energy of the lightness histogram. The lightness contrast to be measured can be defined as |br − bl|.
4.3.1.3 Spatial Composition-Related Features
Not only the color and lighting compositions are important for the image appeals, but also the locations of objects and their mutual spatial relations play an important role in the aesthetic quality of the image. Professional photographers follow a wealth of composition knowledge and techniques [1]. By shuffling the pixels of an aesthetically appealing professional photograph (Figure 4.7a), it is possible to end up getting a noisy and no-longer appealing image, although the previous color and lighting features are not changed (Figure 4.7b). Even when keeping the complete shapes of the semantic objects but just changing their spatial configuration, the aesthetic quality of the resulted image (Figure 4.7c) would be quite different from the original one. The following discussion introduces some popular features used to measure the spatial composition of an image. Many features are inspired by the guidelines and principles in photography, such as golden-section rules, shapes and lines, visual balance, and so on [12].
Golden-section rule
Golden section refers to dividing a line at a particular ratio , so that the ratio of the smaller part to the larger part is the same as the ratio of the larger part to the whole. The rule can be commonly found in nature, and has been widely used in photography and art as a tool in order to achieve balance and beauty. The golden-section rule specifies that the focus (main object of the interest) should be located at one of the four intersections as shown in Figure 4.8. In photography, this rule is often approximated by the so-called rule of thirds, which approximates the golden ratio as 1/3. So, the first spatial composition-related feature is to measure how well the composition of an image fits with this rule. The procedure starts with deciding the main object of interest in the image. Some methods of extracting the main subject of the image were proposed in Reference [18]. Another work [22] considered face as the main subject whenever there is face within the image and performed face detection to extract it. Various object detection and region segmentation techniques can also be used to identify the main object of the image. Once the main object has been found, the golden rule-based feature can be computed as the minimum among the distances between the object center and all four golden-section line intersections:
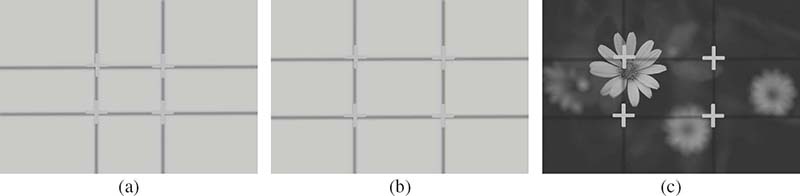
FIGURE 4.8
Demonstrations of the golden-section rule and its approximation, rule of thirds, in photography: (a) golden-section rule, (b) rule of thirds, and (c) subject at one of the intersections.
where (Ox,Oy) denotes the coordinates for the center of the object of interest and is the set of coordinates for the four intersection points. All the coordinates are normalized by the width and height of the image, respectively. If considering multiple objects/regions of interest, the above feature can be computed for each salient object/region and then combined using some appropriate techniques. An optional method for combining the set of features , where j = 1,2,...,J for the J salient objects, is given by
The term G(·) denotes a function performing a certain transform on the input features, and wj is the weight given to the jth salient object. Both G(·) and wj can be chosen based on the applications and the specific algorithms. For example, some previous works [27], [28] use G(x) = e−x2. In Reference [27], wj is set to be the mass of the jth salient region, while in Reference [28], wj indicates an importance calculated by some algorithm.
Visual balance
Balance is an important concept related to visual harmony and aesthetics. Reference [12] discusses that salient objects are preferred to be distributed near-evenly around the center of the image for the sake of visual balance. The statement on the “right and left” balance in visual psychology says: an object with a fixed size seems to have more weight when put on the right, thus its size needs increasing when put on the left for balance [15]. This statement suggests larger objects on the left can balance with smaller objects on the right. A simple way to measure the visual balance is as follows. Consider the top J most salient regions (objects) in the image. The procedure first computes the center and the respective mass Mj for the jth region. This is followed by computing the offset between the weighted average center for these J regions and the image center , as follows:
with the coordinates normalized, respectively, by the width or height of the image.
Shapes
Shapes are crucial components in an image, so they can significantly affect the aesthetic quality of the image. Reference [19] computed the high-order central moments on the coordinates within a segmented region to represent the shape of the region. Reference [4] computed the convex hull of a segmented region, and used the ratio of pixels within the hull to measure the degree of convexity for the region. However, both metrics can only roughly measure some characteristics of the shapes. Moreover, there is still not enough understanding of which kind of shape enhances the image appeals. To overcome this drawback, it is possible to measure the shape in more detail and leave the learning algorithm to figure out the useful properties. Borrowing the technique “bag of features” [40], [41] popularly used for image matching, each region can be represented as a collection of local features, such as scale-invariant feature transform (SIFT) [42] and maximally stable extremal region (MSER) [43] features. Another problem is that the segmentation process is not always reliable and can break one semantic region into multiple segments or merging semantically non-related regions into one. Potential solutions to these problems can replace the segmentation technique with the spatial pyramid matching technique [44] to compose the shape-related features within spatially divided regions at multiple scales. Alternatively, other techniques, such as object detection and saliency detection, can also be used to better divide the image into meaningful elements.
Texture and patterns
Texture describes the structural characteristics of a surface, which can be classified as graininess, smoothness, line-likeness, regularity, and others. As discussed in Reference [4], whether an image looks grainy or smooth as a whole is related to the camera settings and techniques used by the photographer. A grainy image due to high ISO settings or a smooth image due to out-of-focus capturing is generally not visually preferred. Moreover, texture is not only related to the photo-shooting conditions, but also an important artistic element of the image composition in photography. Patterns, which are regular texture with more or less repetitive entity, can often evoke aesthetic feelings in humans. Figure 4.9 shows some examples with patterns. Although Figure 4.9c is not even a professional photograph, it is still pleasing to the eyes of the audience because its regular organization of smiling faces into rows. To extract texture- and pattern-related features, Reference [4] used Daubechies wavelet transform [45] to measure the spatial smoothness in the image. The reader should also refer to the literature on texture analysis [46], [47], [48], [49], [50], [51], [52]. However, prior works in texture analysis mainly focus on basic pattern, such as dots, lines, and lattice. Only very few studies have explored the detection of patterns formed by complex entities, such as the faces in Figure 4.9c. An example can be found in Reference [53], which proposed a graph-based algorithm for finding rows of people in group images; this concept can be extended to other object entities.
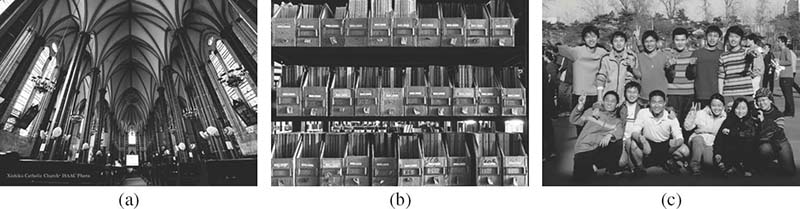
FIGURE 4.9 (See color insert.)
Texture and patterns. Patterns in these examples evoke aesthetic feelings.
4.3.1.4 Depth-Related Features
Image is represented as a two-dimensional plane. However, the real world is composed of three dimensions. Therefore, a number of techniques have been used in photography to create the illusion of depth in an image. For example, professional photographers often compose images in linear perspective, as shown in Figure 4.10. Linear perspective is useful in extending human’s imagining space out of the limited image space. Another commonly used technique to create depth illusion is to compose the sharpness and blurring properly. The contrast between sharp regions and blurring regions can help the viewer to catch easily the subject emphasized in the image. Besides these two techniques, professional photographers also use light, shadow, and color to enhance the three-dimensional impression of an image [54]. The following discussion focuses on two features related to the depth characteristics of an image: linear perspective and sharpness-blurring distribution.
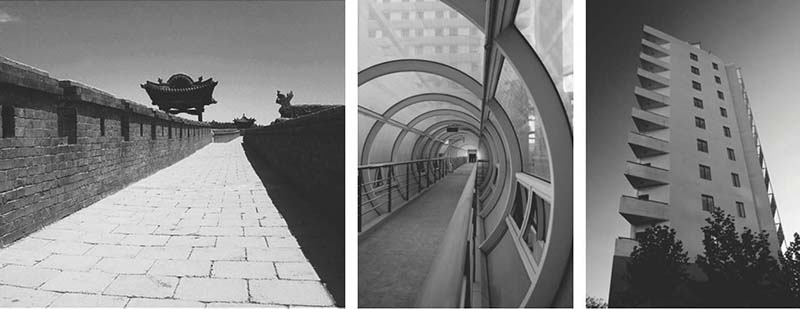
FIGURE 4.10 (See color insert.)
Linear perspective in photographs.
Linear perspective
Linear perspective is characterized by converging lines. In reality, the edges of the road, the edges of the skywalk, and the vertical lines of the building sides in Figure 4.10 are actually parallel. However, they appear to converge to a vanishing point in human eyes, though they are still perceived as straight and parallel. Since the image recorded by the camera is also optical, the same vanishing effect appears in the image, and it can be strengthened or weaken by various skills used by the photographers. The linear perspective effect of an image can be represented by estimating the vanishing point or the vanishing line of the image, and use their locations as features. The problem of vanishing point and vanishing line detection and estimation have been addressed in many previous studies [55], [56], [57], [58], [59], and [60].
Sharpness-blurring distribution
To represent the sharpness, the presence of high-frequency edges is of interest. Professional photographers often reduce the depth of field while focusing on only a single object or region in the scene, which results in a clarified composition with sharp focusing region and blurred background and avoids producing an unpleasant cluttered scene. In Reference [4], the authors measure the ratio of high-frequency elements within the center regions over the whole image, assuming that the object of interest is usually near the center of the image. However, the location of the object of interest may vary from image to image. Another way to measure the spatial distribution of edges is to measure how compact the sharp region is. The following introduces a method similar to that proposed in Reference [17]. First, the Laplacian filter is applied to the grayscale version of the image, and take the absolute values of the results to generate an edge map E(x,y) for the image. The next step aims at finding the smallest bounding box that encloses a high ratio re of the edge energy. To do this, the edge map E(x,y) can be projected onto the vertical and horizontal directions, respectively, as follows:
Figure 4.11 illustrates the implementation on an example image. For the projected vector PX(orPY), the procedure search for the minimal region that centralizes the ratio of energy of the vector as follows:
Note that re is set to 96.04% in Reference [17]. Then, the area of the bounding box is computed to measure the compactness of the bounding box. Note that the image height and width are both normalized to one in the whole process. With this metric, for a cluttered image the area of the bounding box would be large while for a well-focused image the area of the bounding box would be smaller.
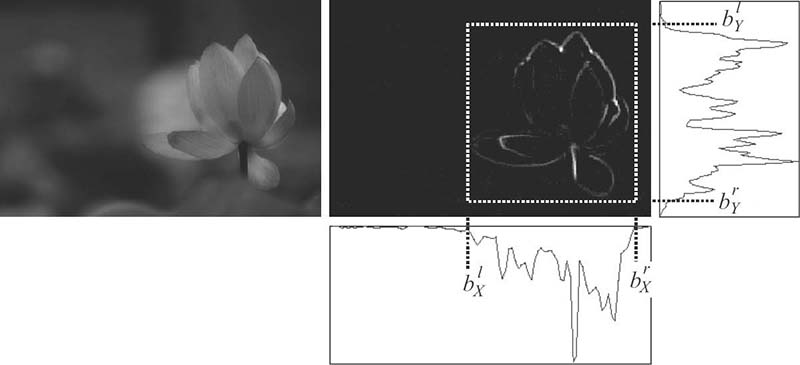
FIGURE 4.11
Illustration for the computation of the sharpness-blurring distribution feature.
4.3.1.5 Main Subject-Related Features
Professional photographers make use of various techniques to highlight the main subject of the photo. Therefore, not every part in an image contributes equally to the aesthetic quality of the image. The subject region, which may receive more attention from the viewer, can have a more significant impact on the image appeals than the background regions. Before discussing any further about the characteristics of the subject region, various ways of separating the subject region from the background should be considered.
Subject region detection
Reference [18] presents an efficient subject detection algorithm based on the assumption that the subject regions appear as a clearer area in the photo while the background looks blurrier. In the literature on saliency detection, many computational algorithms [61], [62], [63], [64], [65] have been proposed to extract the subject region in the image based on the characteristics of color, edge, contrast, and frequency distribution. Furthermore, if some prior information about the content of the images or the object categories of interest is available, object detection algorithms can be used to identify objects in certain categories. Among the thousands of object categories present in a daily life, research in visual psychology [54] presents that the most common high-attractant subjects are the key parts of the human face. Research in the nervous systems also shows that there are specific brain modules for recognizing faces. Thus, when faces are present in an image, some works [21], [22], [23] consider faces as salient subjects, and extract features within the detected facial regions for predicting the image aesthetics. In these cases, face detection algorithms are used to detect the subject regions of the image. Besides the faces, many other objects can be present as the main subject of the image, depending on the scenario where the image is taken. For example, if an image is already known to be taken in the zoo, then it is more likely that animals are the subjects; similarly, if it is taken in a garden, then it is more likely for the flowers to be the subjects. All these contextual information have not been thoroughly exploited to help aesthetics prediction, which will be among the future directions.
The following discussion presents certain features proposed in prior works [18], [22], [66] based on the separation of the foreground subject region and the background. While the features discussed earlier in this chapter are mostly extracted from the whole image, many of them can also be extracted within the subject region correspondingly to represent the color, illumination, texture, and depth characteristics of the subject region. Besides, it is possible to measure the contrast between the subject regions and the background in sense of lighting, blurring, and so on.
Colorfulness of the subject region
The hue count feature introduced in Equation 4.1 is computed for the subject region to indicate how colorful this region is.
Background simplicity
In general, simple background can help the viewer better focus on the subject region. The simplicity of the background can be measured using the color distribution of the background region. Each of the RGB channels can be quantized into K bins, creating a histogram of K3 bins. Then, the procedure evaluates the number of bins that have counts larger than a threshold, which is set to be a small ratio (for example, 0.1) of the maximum count in the histogram.
Spatial location of the subject region
As discussed earlier, the location of the subject region has a high impact on the spatial composition of the image in the sense of visual balance and the fitness to rule of thirds. Here the minimal distance between the subject center and one of the four intersection points in Figure 4.8 is calculated, as described in Equation 4.5. The offset from the subject center to the image center is also measured as features related to visual balance.
Subject-background contrast
In this case, the contrast between the subject region and the background is evaluated in terms of color, lightness, and sharpness. For color contrast, the color histogram of the subject region Hists and that of the background region Histb can be extracted to compute the feature 1 − < Hists, Histb > / (‖Hists‖‖Histb‖), where < ·,· > is the operation of inner product. For lightness contrast, the average brightness of the subject region Ls and Lb is computed to measure the contrast as log(Ls/Lb). For the sharpness contrast, the procedure first computes H fs, which is the ratio of the area of high-frequency components in the subject region over the subject area and H fI, which is the ratio of the area of high-frequency components across the whole image over the image area. The high-frequency components can be detected through Fourier transform or wavelet techniques. Then, the sharpness contrast feature can be defined as H fs/H fI.
Face-related features
Faces are among the most effective objects that evoke the viewer’s emotion. The number of faces, the sizes of the faces, the spatial relationship between multiple faces, and the facial expressions and poses, all have impacts on the image aesthetics. Among these features, the spatial relationship between multiple faces more or less indicate how close the people in the photo are in their social relationship. An intuition is that if the people within an image look close to each other, it may arouse a pleasant feeling in the viewer. In Reference [22], the authors first extracted a tree graph connecting neighbor faces together, and then measured the average distance across all pairs of connected faces. Furthermore, to measure facial characteristics, such as expressions and poses, one can take advantage of the existing face expression classification and face pose estimation techniques and generate high-level attributes based on the outputs from these modules, as will be discussed below.
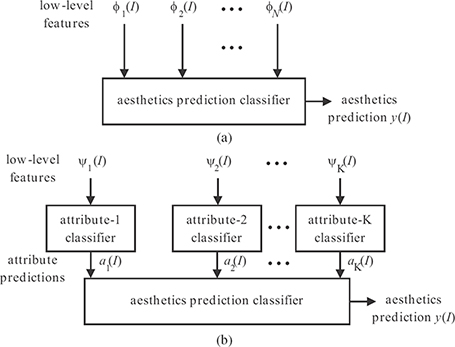
FIGURE 4.12
Aesthetics prediction schemes based on different inputs: (a) aesthetic prediction using low-level features and (b) aesthetic prediction using high-level attributes. The term y(I) denotes the aesthetics prediction for the input image I. Low-level features ϕn(I), for n = 1,2,...,N, are extracted based on human intuition to represent the image appeal. Low-level features ψk(I), for k = 1,2,...,K, are used as inputs for the kth attribute classifier, whose outputs are the attribute predictions ak(I).
In summary, this section has presented five groups of low-level features to represent the image appeal in terms of color, illumination, spatial composition, depth, and the subject region. It has focused on explaining the intuition and knowledge that inspire the design of the features, rather than introducing all features described in previous works, to encourage the reader to come up with more interesting and effective features.
4.3.2 High-Level Attributes
The previously discussed features are designed to represent high-level attributes in aesthetics, such as image composition, subject-background contrast, and so on. However, these features themselves may not explicitly describe the aesthetic properties. Inspired by the recent progress of using describable attributes to improve the performance of object recognition [67], [68], Reference [25] proposed three groups of describable image attributes for aesthetics: i) compositional attributes related to the image layout or configuration, ii) content attributes related to the objects or scene types depicted, and iii) sky-illumination attributes related to the natural lighting conditions. Instead of designing low-level features related to these characteristics (Figure 4.12a) as discussed in Section 4.3.1, the proposed method in Reference [25] explicitly trained classifiers to recognize various high-level describable attributes (Figure 4.12b).
TABLE 4.2
The three groups of attributes proposed in Reference [25].
Composition Attributes |
Content Attributes |
Sky-Illumination Attributes |
presence of a salient object |
presence of people |
clear skies |
rule of thirds |
portrait depiction |
cloudy skies |
low depth of field |
presence of animals |
sunset skies |
opposing colors |
indoor-outdoor classification scene type (15 categories) |
|
Table 4.2 summarizes the three groups of attributes used in Reference [25]. For each attribute, a classifier or predictor is trained on data that contain manual labels for the respective attribute. For example, in order to build a classifier for the “low depth of field” attribute, the authors first collected a dataset of thousands of images with manual labels indicating whether an image has low depth of field. Then, the authors trained a support vector machine (SVM) classifier taking Daubechies wavelet-based features as inputs and outputting a score to indicate how confident the image has low depth of field. Similarly, to build a classifier for the “clear skies” attribute, which describes whether a photo is taken in sunny clear weather conditions, three-dimensional color histograms are computed on roughly segmented sky regions, followed by a SVM classifier trained using the manually labeled images.
Experiments in Reference [25] demonstrated that using the high-level attributes produced a significantly more accurate ranking than using the low-level features proposed in Reference [17]. Moreover, the combination of both the low-level features and the high-level attributes resulted in an even stronger classifier for predicting aesthetics. This suggests that the low-level features and the high-level attributes can provide useful complementary information for each other.
High-level attributes to be used in the aesthetic quality assessment are not limited to those proposed in Reference [25]. Consider color characteristics of images as an example. Although the only color-related attribute in Table 4.2 is the presence of opposing colors, there exist works, such as References [19] and [26], that use all the color harmony models proposed in Reference [38] to represent “the presence of color harmony” attribute within the image. As another example one can consider attributes related to the presence of different objects. The presence of people and animals can influence the aesthetic impression of an image, and other objects, such as plants and decorations, can also be correlated with image aesthetics. Given that the second-stage aesthetic classifier can automatically learn the importance of different attributes, the more information about the visual content of the image is derived, the better the aesthetic quality can be predicted. This makes the task of aesthetic quality assessment no longer an isolated task in computer vision, but can be benefited from many other tasks that have been more thoroughly explored, such as scene categorization, object detection, depth estimation, saliency detection, geometric layout prediction, and perspective estimation. One can simply take advantage of the existing state-of-the-art algorithms for all these different tasks and use their outputs as attribute inputs for the aesthetics classifier, as shown in Figure 4.13.
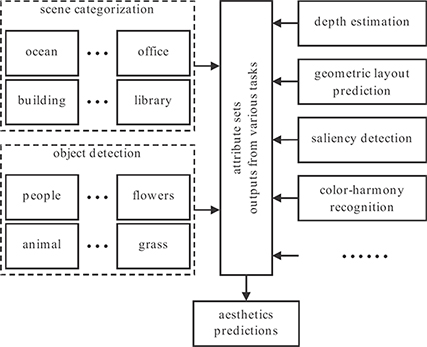
FIGURE 4.13
Seeking help from various tasks in computer vision toward the aesthetic assessment.
4.4 Learning Models for Aesthetic Quality Assessment
The previous section has identified a set of features, including the low-level features and high-level attributes, to represent the image appeal. Although the design of some features are inspired by rules in photography, art, and psychology, no rules are manually set here for the mapping from the computational features to the aesthetics scores. This section will introduce the learning modules applied to the extracted features.
4.4.1 Feature Selection
In the earlier stage, various aspects potentially related to image aesthetics can be taken into account, thus likely resulting in a large-size feature set. However, some features may cover overlapping information with others, and some may be less correlated to the human ratings than others. Especially when considering outputs from some relevant tasks, such as high-level attributes (for example, the predicted depths across the image from the depth estimation task), the dimension of the features becomes very high and can suffer from overfitting in building learning models. Dimension reduction algorithms and feature selection algorithms are both well-studied topics in machine learning. Compared to popular dimension reduction algorithms like principle component analysis (PCA), feature selection approaches, which try to find a subset of the original features, provide greater power in interpreting the resulted low-dimension features. There are two common strategies in feature selection [69]: filter-based approaches and wrapper-based approaches. Filter-based approaches work as a preprocessing step to remove redundant features based on metrics, such as correlation and mutual information, or remove irrelevant features based on the class separability of individual features. Wrapper-based approaches choose features by searching through the space of possible features and evaluating the subsets by running the classifier on the subset. For example, among previous works in aesthetics assessment, Reference [4] used the forward selection algorithm, References [16] and [19] used boosting algorithms [70], [71], and Reference [28] used L1-sparsity based linear model [72], in order to select features.
4.4.2 Classification
Many works on assessing visual aesthetics have formulated the quality assessment problem as a classification problem. Formulating the task into a classification problem not only provides an easier starting point for this new research area but also reduces the noise due to the inconsistency of the human ratings. The ratings are highly subjective, and different people may have different standards for their ratings. Even the ratings given by the same person toward different images are likely to be made based on not the same standards. Therefore, the slight differences in the average scores within a certain range, are not necessarily meaningful. Instead, considering images whose average scores are within a certain range as a group, can help to eliminate the effect from inconsistent ratings. In this case, each group of images represent the aesthetic quality at a certain level, corresponding to a certain quality category. Hence, by dividing the average scores in to M regions, one ends up with an M-class aesthetic quality classification problem, defined below.
Consider a set of images with aesthetic quality labels (I1,y1), (I2,y2),...,(IN,yN), where Ii indicates the features extracted from the respective image and yi is the quality class label for the respective image. In the training stage, a classification algorithm is learned to discriminate the data in different classes. In the testing stage, given a testing image with extracted features Itest, the learned algorithm predicts its quality label .
Many previous works treat the problem as a binary classification problem, that is, M = 2. The two classes are defined as “high-aesthetic quality” and “low-aesthetic quality.” As discussed in Section 4.2.2, the human ratings from some controlled studies [21], [22] have shown that the rating variance values for images with extremely low or extremely high average scores are lower than those for images with average scores in the middle. Therefore, to reduce ambiguity, previous works often choose images with top average scores as the high-quality class and images with bottom average scores as the low-quality class. Classifiers used in previous works include decision trees [4], Bayesian classifiers [16], [17], [18], [19], [73], SVM [4], [16], [18], [22], [25], boosting [16], [18], [19], and so on.
To evaluate the performance of an aesthetic quality assessment algorithm whose learning module performs classification, one can use the general metrics in classification. For the two-class aesthetics classification, the receiver-operating characteristic curve or precision-recall curve are generally used. Take the precision-recall curve as an example. At any threshold set to separate the testing outputs, the precision and recall are computed as
To evaluate a multi-class aesthetics classification algorithm, some previous works [22] used the metric cross-category error (CCE). Consider M categories and the category label increasing from 1 to M to indicate that the respective quality varies from lowest to highest, that is, Category 1 indicates the lowest aesthetic-quality category while Category M indicates the highest aesthetic-quality category. The CCE is then defined as follows:
where Ntest denotes the number of photos for testing, yi is the ground-truth category label for the ith test image, and is the estimated category label for the ith test image. The function ? (·) equals to one when its content stands, otherwise it equals to zero. The term CCE(k) indicates the ratio of images whose estimated labels has a k-category offset to their respective ground-truth labels.
4.4.3 Regression
Although the classification solution can help to eliminate the learning model from over-fitting to the noisy scores, the ideal target is to have the computer robustly predict aesthetic scores as human do. Especially for some tasks like ranking photos based on aesthetics, one may want more accurate score outputs other than just rough quality levels since the learning in classification problems do not ensure to catch the relative ranking between images in the same category. Therefore, this section describes regression models for connecting the extracted features and the human ratings on the image aesthetics.
Regression for aesthetic quality prediction. Consider a set of images with aesthetic quality labels (I1,s1),(I2,s2),...,(IN,sN), where Ii indicates the features extracted from the respective image and si is the average rating score on aesthetics for the respective image. In the training stage, a regression model is learned to approximate the mapping between the image features and the desired scores. In the testing stage, given a testing image with extracted features Itest, the learned model predicts its aesthetic quality score .
Previous attempts on using regression algorithms for aesthetics prediction relied on linear regression [4], [22], [28], [73], SVM regression [22], and so on. To evaluate the performance of the predicted aesthetics, the residual sum-of-squares error defined as
is commonly used. Here, Ntest is the number of photos for testing, si is the ground-truth aesthetic score for the ith test image, and is the respective estimated score. To verify whether the extracted features have contribution to the prediction, Reference [4] proposed the processing flow depicted in Algorithm 4.1.
ALGORITHM 4.1 Verification of the extracted features contributing to the aesthetic quality prediction.
Shuffle the ground-truth scores for the training images, so that the correlation between the scores and the features are broken.
Train the regression model based on the shuffled scores.
Test the resulted model on the testing data and compute the .
Repeat the above operations for several rounds and calculate the average error as .
Compare with the performance Rres from the normal algorithm. If Rres is obviously smaller, it indicates that the extracted features contribute to the aesthetic quality prediction.
4.5 Applications
With the proliferation of digital cameras, the number of photos that can be accessed online and that are stored in personal photo albums is growing explosively. In 2010, an average of 6.5 million photographs were uploaded daily by the users of Flickr. People instinctually seek for visual aesthetics in daily life. Automatic aesthetic quality assessment can help people better search, browse, manage, and create visually appealing photos. This section discusses several real-life applications of aesthetic quality assessment.
4.5.1 Aesthetics Assisted Web Search
Many of the previous works on visual aesthetics assessment [17], [18], [25] have demonstrated the effectiveness of their algorithms in refining the ranks for images retrieved from popular web search applications. A common situation of using current image search engines is as follows. The search engine retrieves a large amount of related results based on the user’s query; however, the top results do not look visually appealing. In that case one need to browse more results to find the one that is both relevant and visually satisfying. In this situation, automatic aesthetic quality assessment can reduce this effort. Acting as a postprocessing step, the aesthetic quality assessment algorithm re-ranks the top retrieved images based on their aesthetics. As a result, the top ranked images are of higher quality. In the future, the ranking based on aesthetics is expected to be combined with other ranking criteria in order to provide a more enjoyable experience in image search experience.
4.5.2 Automatic Photo Enhancement
Photo editing tools are commonly used by photographers and designers to modify some characteristics of a photo according to the user’s intent. Commercial software like Adobe Photoshop provides such tools but often requires the user to have good knowledge of design concepts and photography theory. For general users, it is unclear which elements need to be edited and how to edit them in order to make their images more appealing. In this case, an automatic photo-editing tool for increasing the image aesthetics would be helpful. As discussed in Reference [27], developing such a tool is a twofold problem: how to edit the image and how to measure the aesthetics for different editing proposals. The answer to the latter is to employ the aesthetic quality assessment technique. Some success has been achieved using the aesthetic quality assessment technique to help photo editing [26], [27], [28], [29], [30]. Reference [26] focused on editing the color aesthetics in terms of harmony; the best editing scheme is chosen by measuring the different aesthetic qualities resulting from fitting different color harmony schemes. Other works [27], [28], [29], [30] utilized the assessment of composition-based aesthetics to aid in the automatic editing of photo composition. A common implementation is to iterate between two operations: selecting a candidate scheme and evaluating the aesthetic quality of the candidate scheme. All of these attempts demonstrate the promising potential of the aesthetics assessment technique, which allows a computer not only to tell the user how good a photo looks but also to help the user to enhance the photo appeal automatically.
4.5.3 Photo Selection and Album Management
As discussed in Section 4.5, the proliferation of personal photos raises an issue: manually managing a large amount of photos would be time consuming. Thus, it becomes necessary and important to develop automated tools for efficient photo selection and management. Automated tools, such as those in References [20] and [31], have been proposed to better organize and retrieve photos based on various photo characteristics. Consider the manual photo selection process for general people. Aesthetic visual quality actually plays an important role in this process. Reference [28] presented a photo selection application to select quintessential photos from large personal photo collections. The input of the application, a personal album, can be a collection of photos taken during a trip with friends, a collection of photos from a series of family events, and so on. The photos might contain different individuals and can be taken in different places and by different cameras. The core algorithm in this application measures the quintessence in terms of appeal and representation. Regarding photo appeal, the selected photos are expected to have high scores predicted by the aesthetic quality assessment algorithm. Regarding representation, the selected photos are supposed to cover as many different scenes and as many different people that have appeared in the collection as possible. As a result, the top selected photos are not only aesthetically appealing but also diverse in sense of scene ad people inside the image. This application demonstrates the potential of using aesthetic quality as an optional metric for photo indexing in album management.
4.5.4 Personalized Aesthetics
So far, this chapter has considered a learning setting trained on the average ratings and the consensus in a general community. As a result, a model for predicting the consensus-based aesthetics has been learned. However, given sufficient information and feedback from a single user or a small group of users that share similar opinions in aesthetics, personalized models of aesthetics can be learned. Since the aesthetic quality assessment is a highly subjective task, individual models can help adapt to different tastes. Personalization was discussed in Reference [34], but no computational implementation was provided there. A personalized photograph ranking and selection system was proposed in Reference [24], where information given by the users were employed to train and adjust the parameters inside the score prediction module. The system provided two personalized ranking user interfaces: one is feature based, and the other is example based. Users can provide either their preferences on some specific aspects of the image (feature based), or select their preferred and non-preferred examples (example based). With the extra user input, the system outperformed the previous algorithms [17], [18] that studied only the general aesthetics. Also, a human study showed that the example-based interface was preferred by twice as many people than the feature-based one. This result is understandable, since the feature-based input may be confusing for the general users who are not familiar with the underlying characteristics of images. Recently, a preliminary attempt on learning the personalized aesthetics of videos was conducted [32]. Although only two persons were investigated in this initial trial, the preliminary results showed that the personalized aesthetics learners can produce more accurate predicted aesthetic scores than the generalized aesthetics learner.
4.5.5 Video Aesthetics
With the increasing attention on image aesthetics and the proliferation of videos on the Internet, research has been extended from image aesthetics to video aesthetics [18], [32]. Two databases used for video aesthetics have been constructed. The dataset used in Reference [18] contains 4000 professional movie clips and 4000 amateurish clips, labeled as high aesthetic quality and low aesthetic quality videos, respectively. However, as pointed out in Reference [32], there is not enough information on how the dataset was obtained, what the video contents are, or how well the assumption of equating professional videos to aesthetically high quality videos stands. To address these problems, a smaller but better-controlled consumer video dataset was proposed in Reference [32]. This database contains 160 videos from YouTube with aesthetic scores collected via a controlled human study. Although the existing datasets are not well controlled or relatively small, they provide a starting point to explore video aesthetics.
The main difference between video content and image content lies in the additional temporal and motion information across the frames in a video sequence. Therefore, besides using previously mentioned image-based features, the recent works [18], [32] proposed a series of features related to the temporal and motion characteristics, including the length of the subject region motion in the video, the motion stability, the actual frame-rate in the video, the blockiness effect from video compression, and so on. While Reference [18] combined the frame-based features by taking the average, Reference [32] proposed a two-stage pooling strategy: first, generating shot-based features by combining the frame-based features and second, generating the video feature from the shot-based features. The promising results reported in these works help to envision many potential applications in the near future. For example, Reference [32] presented some plans to develop aesthetics-assisted hierarchical user interfaces to allow end-users to efficiently navigate their personal video collections. Furthermore, as the image aesthetics assessment technique can help to re-rank the results from the image search engines, video aesthetics assessment techniques can be also utilized to refine the results returned by the online video search engines.
Applications that can benefit from aesthetic quality assessment are not limited to the above examples. For instance, a real-time aesthetic quality assessment module could be integrated into the cameras to feature new functions, such as providing users with real-time composition or lighting suggestions. However, continuous efforts are needed to advance the development of the aesthetic quality assessment techniques.
4.6 Conclusion
This chapter discussed the assessment of the visual aesthetic quality. Because of the subjectivity of aesthetics, the problem of aesthetic quality assessment is far more difficult compared to objective quality assessment, which measures the image quality or its lack due to various degradations, for example, introduced during image acquisition, or caused by faulty transmission or aggressive processing / compression. Recent efforts [4], [17], [18], [19], [22], [24], [32] in this area have achieved some progress, by addressing the automatic evaluation of aesthetics as a machine learning problem. Following the general flow used by recent algorithms, this chapter discussed the basic modules in developing algorithms for aesthetics assessment: data collection and human study, computational feature extraction, and learning techniques. The focus was on the computational feature extraction, since the features designed to represent the aesthetic characteristics have immediate influence on the amount of useful information passed to the following learning modules. Efforts toward feature extraction span from designing effective image features according to the knowledge and experience in visual psychology, photography, and art, to creating high-level attributes by employing state-of-the-art techniques from other computational vision areas.
Although promising results have been demonstrated by recent works in predicting the visual aesthetics, there are many avenues that still need to be explored. Computational aesthetics is a challenging multidisciplinary research topic. Closer communication and collaboration between researchers in the areas of psychology, photography, and computational vision will be of great help for further progress. On the visual computing side, researchers have been making continuous efforts to exploit, through computational intelligent algorithms, the underlying structures, and characteristics within the images, which relate to the perceived quality by humans. Furthermore, it is also worthwhile to develop more real-life applications based on the assessment of visual aesthetics in order to attract more attention from the general community, from whom stronger support in terms of data collection, human study, and algorithm design can be achieved.
Acknowledgment
Professional photographs presented in this chapter have been taken by Shun Zeng. The remaining photographs have been taken by the authors.
References
[1] B. Martinez and J. Block, Visual Forces, an Introduction to Design. New York, USA: Prentice-Hall, 1998.
[2] G. Peters, “Aesthetic primitives of images for visualization,” in Proceedings of the International Conference on Information Visualization, Zurich, Switzerland, July 2007, pp. 316–325.
[3] V. Rivotti, J. Proença, J.A. Jorge, and M.C. Sousa, “Composition principles for quality depiction and aesthetics,” in Proceedings of the Eurographics Workshop on Computational Aesthetics in Graphics, Visualization and Imaging, Banff, AB, Canada, June 2007, pp. 37–44.
[4] R. Datta, D. Joshi, J. Li, and J.Z. Wang, “Studying aesthetics in photographic images using a computational approach,” in Proceedings of the European Conference on Computer Vision, Graz, Austria, May 2006, pp. 21–26.
[5] A.K. Moorthy and A.C. Bovik, “Visual quality assessment algorithms: What does the future hold?,” Multimedia Tools Applications, vol. 51, no. 2, pp. 675–696, January 2011.
[6] S. Zeki, Inner Vision: An Exploration of Art and the Brain. New York, USA: Oxford University Press, 1999.
[7] K.B. Schloss and S.E. Palmer, “Aesthetic preference for color combinations,” in Proceedings of the 7th Annual Meeting of the Vision Science Society, Sarasota, FL, USA, May 2007, pp. 123–128.
[8] C. Nothelfer, K.B. Schloss, and S.E. Palmer, “The role of spatial composition in preference for color pairs,” in Proceddings of the 9th Annual Meeting of the Vision Science Society, Naples, FL, USA, May 2009, pp. 623–627.
[9] R.M. Poggesi, K.B. Schloss, and S.E. Palmer, “Preference for three-color combinations in varying proportions,” in Proceedings of the 9th Annual Meeting of the Vision Science Society, Naples, FL, USA, May 2009, pp. 613–617.
[10] O. Axelsson, “Towards a psychology of photography: Dimensions underlying aesthetic appeal of photographs,” Perceptual and Motor Skills, vol. 105, no. 2, pp. 411–434, January 2007.
[11] J. Gardner, C. Nothelfer, and S.E. Palmer, “Exploring aesthetic principles of spatial composition through stock photography,” in Proceedings of the 8th Annual Meeting of the Vision Science Society, Naples, FL, USA, May 2008, pp. 337–338.
[12] B. Krages, Photography: The Art of Composition. New York, USA: Allworth Press, 2005.
[13] M. Freeman, The Photographer’s Eye: Composition and Design for Better Digital Photos. Lewes, UK: The Ilex Press, 2007.
[14] B. London, J. Upton, J. Stone, K. Kobre, and B. Brill, Photography. London, UK: Pearson Prentice Hall, 2005.
[15] R. Arnheim, Art and Visual Perception: A Psychology of the Creative Eye. Berkeley, CA, USA: University of California Press, 1974.
[16] H. Tong, M. Li, H. Jiang Zhang, J. He, and C. Zhang, “Classification of digital photos taken by photographers or home users,” in Proceedings of Pacific Rim Conference on Multimedia, Tokyo, Japan, November 2004, pp. 198–205.
[17] Y. Ke, X. Tang, and F. Jing, “The design of high-level features for photo quality assessment,” in Proceedings of the IEEE Conference on Computer Vision and Pattern Recognition, New York, USA, June 2006, pp. 419–426.
[18] Y. Luo and X. Tang, “Photo and video quality evaluation: Focusing on the subject,” in Proceedings of the European Conference on Computer Vision, Marseille, France, October 2008, pp. 97–100.
[19] C. Li and T. Chen, “Aesthetic visual quality assessment of paintings,” IEEE Journal of Selected Topics in Signal Processing, vol. 3, no. 2, pp. 236–252, April 2009.
[20] A. Loui, M. Wood, A. Scalise, and J. Birkelund, “Multidimensional image value assessment and rating for automated albuming and retrieval,” in Proceedings of the International Conference on Image Processing, San Diego, CA, USA, October 2008, pp. 97–100.
[21] C. Cerosaletti and A. Loui, “Measuring the perceived aesthetic quality of photographic images,” in Proceedings of the First International Workshop on Quality of Multimedia Experience, San Diego, CA, USA, July 2009, pp. 282–289.
[22] C. Li, A. Gallagher, A. Loui, and T. Chen, “Aesthetic quality assessment of consumer photos with faces,” in Proceedings of the IEEE International Conference on Image Processing, Hong Kong, September 2010, pp. 3221–3224.
[23] W. Jiang, A. Loui, and C. Cerosaletti, “Automatic aesthetic value assessment in photographic images,” in Proceedings of the IEEE International Conference on Multimedia and Expo, Singapore, July 2010, pp. 920–925.
[24] C.H. Yeh, Y.C. Ho, B.A. Barsky, and M. Ouhyoung, “Personalized photograph ranking and selection system,” in Proceedings of the International Conference on Multimedia, Firenze, Italy, October 2010, pp. 211–220.
[25] S. Dhar, V. Ordonez, and T.L. Berg, “High level describable attributes for predicting aesthetics and interestingness,” in Proceedings of the IEEE Conference on Computer Vision and Pattern Recognition, Colorado Springs, CO, USA, June 2011, pp. 122–133.
[26] D. Cohen-Or, O. Sorkine, R. Gal, T. Leyvand, and Y.Q. Xu, “Color harmonization,” ACM Transactions on Graphics, vol. 25, no. 3, pp. 624–630, July 2006.
[27] L. Liu, R. Chen, L. Wolf, and D. Cohen-Or, “Optimizing photo composition,” Computer Graphic Forum, vol. 29, no. 2, pp. 469–478, January 2010.
[28] C. Li, A.C. Loui, and T. Chen, “Towards aesthetics: A photo quality assessment and photo selection system,” in Proceedings of the International Conference on Multimedia, Firenze, Italy, October 2010, pp. 827–830.
[29] S. Bhattacahrya, R. Sukthankar, and M. Shah, “A framework for photo-quality assessment and enhancement based on visual aesthetics,” in Proceedings of the International Conference on Multimedia, Firenze, Italy, October 2010, pp. 271–280.
[30] M. Nishiyama, T. Okabe, Y. Sato, and I. Sato, “Sensation-based photo cropping,” in Proceedings of the 17th ACM International Conference on Multimedia, Beijing, China, October 2009, pp. 669–672.
[31] W.T. Chu, C.H. Lin, and J.Y. Yu, “Feature classification for representative photo selection,” in Proceedings of the 17th ACM International Conference on Multimedia, Beijing, China, October 2009, pp. 509–512.
[32] A.K. Moorthy, P. Obrador, N. Oliver, and A.C. Bovik, “Towards computational models of the visual aesthetic appeal of consumer videos,” in Proceedings of the 11th European conference on Computer vision, Heraklion, Crete, Greece, September 2010, pp. 1–14.
[33] A. Sorokin and D. Forsyth, “Utility data annotation with amazon mechanical turk,” in Proceedings of the Computer Vision and Pattern Recognition Workshop, Anchorage, Alaska, USA, June 2008, pp. 392–398.
[34] R. Datta, J. Li, and J. Wang, “Algorithmic inferencing of aesthetics and emotion in natural images: An exposition,” in Proceedings of the IEEE International Conference on Image Processing, San Diego, CA, USA, October 2008, pp. 105–108.
[35] A.E. Savakis, S.P. Etz, and A.C. Loui, “Evaluation of image appeal in consumer photography,” Proceedings of SPIE, vol. 3959, January 2000, pp. 111–120.
[36] M. Freeman, The Complete Guild to Light and Lighting in Digital Photography. Lewes, UK: The Ilex Press, 2007.
[37] M. Tokumaru, N. Muranaka, and S. Imanishi, “Color design support system considering color harmony,” in Proceedings of the IEEE International Conference on Fuzzy System, Honolulu, Hawaii, USA, May 2002, pp. 378–383.
[38] Y. Matsuda, Color Design. Tokyo, Japan: Asakura Shoten, 1995.
[39] M. Livingstone, Vision and Art: The Biology of Seeing. New York, USA: Harry N. Abrams, 2002.
[40] G. Csurka, C.R. Dance, L. Fan, J. Willamowski, and C. Bray, “Visual categorization with bags of keypoints,” in Proceedings of the European Conference on Computer Vision – Workshop on Statistical Learning in Computer Vision, Prague, Czech Republic, May 2004, pp. 1–22.
[41] J. Winn, A. Criminisi, and T. Minka, “Object categorization by learned universal visual dictionary,” in Proceedings of the IEEE International Conference on Computer Vision, Beijing, China, October 2005, pp. 1800–1807.
[42] D.G. Lowe, “Distinctive image features from scale-invariant keypoints,” International Journal of Computer Vision, vol. 60, no. 2, pp. 91–110, November 2004.
[43] J. Matas, O. Chum, M. Urban, and T. Pajdla, “Robust wide baseline stereo from maximally stable extremal regions,” in Proceedings of British Machine Vision Conference, Cardiff, UK, September 2002, pp. 384–393.
[44] S. Lazebnik, C. Schmid, and J. Ponce, “Beyond bags of features: Spatial pyramid matching for recognizing natural scene categories,” in Proceedings of the IEEE Conference on Computer Vision and Pattern Recognition, New York, USA, June 2006, pp. 2169–2178.
[45] I. Daubechies, Ten Lectures on Wavelets. Philadelphia, PA, USA: Society for Industrial and Applied Mathematics, 1992.
[46] T. Leung and J. Malik, “Representing and recognizing the visual appearance of materials using three-dimensional textons,” International Journal of Computer Vision, vol. 43, no. 1, pp. 29–44, June 2001.
[47] C. Schmid, “Constructing models for content-based image retrieval,” in Proceedings of the IEEE Conference on Computer Vision and Pattern Recognition, Kauai, HI, USA, December 2001, pp. 39–45.
[48] S. Lazebnik, C. Schmid, and J. Ponce, “Affine-invariant local descriptors and neighborhood statistics for texture recognition,” in Proceedings of the IEEE International Conference on Computer Vision, Nice, France, October 2003, pp. 649–655.
[49] O.G. Cula and K.J. Dana, “3D texture recognition using bidirectional feature histograms,” International Journal of Computer Vision, vol. 59, no. 1, pp. 33–60, August 2004.
[50] M. Varma and A. Zisserman, “A statistical approach to texture classification from single images,” International Journal of Computer Vision, vol. 62, no. 1–2, pp. 61–81, April 2005.
[51] J. Hays, M. Leordeanu, A.A. Efros, and Y. Liu, “Discovering texture regularity as a higher-order correspondence problem,” in Proceedings of European Conference on Computer Vision, Graz, Austria, May 2006, pp. 522–535.
[52] M. Park, K. Brocklehurst, R. Collins, and Y. Liu, “Deformed lattice detection in real-world images using mean-shift belief propagation,” IEEE Transactions on Pattern Analysis and Machine Intelligence, vol. 31, no. 10, pp. 1804–1816, October 2009.
[53] A. Gallagher and T. Chen, “Finding rows of people in group images,” in Proceedings of the IEEE International Conference on Multimedia and Expo, New York, USA, June 2009, pp. 602–605.
[54] M. Freeman, The Photographer’s Eye: Composition and Design for Better Digital Photos. Lewes, UK: Ilex Press, 2007.
[55] R. Collins and R. Weiss, “Vanishing point calculation as a statistical inference on the unit sphere,” in Proceedings of International Conference on Computer Vision, Osaka, Japan, December 1990, pp. 400–403.
[56] B. Brillault-O’Mahony, “New method for vanishing point detection,” CVGIP Image Understanding, vol. 54, no. 2, pp. 289–300, January 1991.
[57] M. Antone and S. Teller, “Automatic recovery of relative camera rotations for urban scenes,” in Proceedings of IEEE Conference on Computer Vision and Pattern Recognition, Hilton Head, SC, USA, June 2000, pp. 282–289.
[58] C. Rother, “A new approach for vanishing point detection in architectural environments,” in Proceedings of the 11th British Machine Vision Conference, Bristol, UK, September 2000, pp. 382–391.
[59] J. Kosecka and W. Zhang, “Video compass,” in Proceedings of the European Conference on Computer Vision, Copenhagen, Denmark, May 2002, pp. 476–490.
[60] D. Hoiem, A. Efros, and M. Hebert, “Automatic photo pop-up,” in International Conference on Computer Graphics and Interactive Techniques, Los Angeles, CA, USA, July 2005, pp. 522–535.
[61] L. Itti, C. Koch, and E. Niebur, “A model of saliency-based visual attention for rapid scene analysis,” IEEE Transactions on Pattern Analysis and Machine Intelligence, vol. 20, no. 11, pp. 1254–1259, November 1998.
[62] Y.F. Ma and H.J. Zhang, “Contrast-based image attention analysis by using fuzzy growing,” in Proceedings of the 11th ACM International Conference on Multimedia, Berkeley, CA, USA, November 2003, pp. 374–381.
[63] X. Hou and L. Zhang, “Saliency detection: A spectral residual approach,” in Proceedings of the IEEE Conference on Computer Vision and Pattern Recognition, Minneapolis, MN, USA, June 2007, pp. 1–8.
[64] R. Achanta, S. Hemami, F. Estrada, and S. Susstrunk, “Frequency-tuned salient region detection,” in In Proceedings of IEEE Conference on Computer Vision and Pattern Recognition, Miami, FL, USA, June 2009, pp. 524–531.
[65] T. Liu, Z. Yuan, J. Sun, J. Wang, N. Zheng, X. Tang, and H.Y. Shum, “Learning to detect a salient object,” IEEE Transactions on Pattern Analysis and Machine Intelligence, vol. 33, no. 2, pp. 353–367, February 2011.
[66] X. Sun, H. Yao, R. Ji, and S. Liu, “Photo assessment based on computational visual attention model,” in Proceedings of the 17th ACM International Conference on Multimedia, Beijing, China, October 2009, pp. 541–544.
[67] A. Farhadi, I. Endres, D. Hoiem, and D. Forsyth, “Describing objects by their attributes,” in Proceedings of the IEEE Conference on Computer Vision and Pattern Recognition, Miami, FL, USA, June 2009, pp. 1778–1785.
[68] C.H. Lampert, H. Nickisch, and S. Harmeling, “Learning to detect unseen object classes by betweenclass attribute transfer,” in Proceedings of the IEEE Conference on Computer Vision and Pattern Recognition, Miami, FL, USA, June 2009, pp. 951–958.
[69] I. Guyon and A. Elisseeff, “An introduction to variable and feature selection,” Journal of Machine Learning Research, vol. 3, pp. 1157–1182, March 2003.
[70] J. Friedman, T. Hastie, and R. Tibshirani, “Additive logistic regression: A statistical view of boosting,” Annals of Statistics, vol. 28, no. 2, pp. 337–407, April 2000.
[71] Y. Freund and R.E. Schapire, “A short introduction to boosting,” in Proceedings of the 16th International Joint Conference on Artificial Intelligence, Stockholm, Sweden, July 1999, pp. 1401–1406.
[72] J. Mairal, M. Leordeanu, F. Bach, M. Hebert, and J. Ponce, “Discriminative sparse image models for class-specific edge detection and image interpretation,” in Proceedings of the European Conference on Computer Vision, Marseille, France, October 2008, pp. 297–302.
[73] R. Datta, J. Li, and J.Z. Wang, “Learning the consensus on visual quality for next-generation image management,” in Proceedings of the 15th International Conference on Multimedia, Augsburg, Germany, September 2007, pp. 533–536.