15
Exceeding Physical Limitations: Apparent Display Qualities
Piotr Didyk, Karol Myszkowski, Elmar Eisemann and Tobias Ritschel
15.2 Apparent Contrast Enhancement
15.3 Apparent Brightness Boost
15.4 Image Temporal Resolution Retargeting
15.4.1 Computer Graphics Solutions
15.4.2 Industrial Solutions in Television Sets
15.4.3 Perceptually Motivated Temporal Upsampling for 3D Content
15.5 Apparent Color and Resolution Enhancement
15.6 Apparent Depth Manipulation
15.6.2 Perceptual Disparity Model
15.1 Introduction
Existing display devices introduce a number of physical constraints, which make real-world appearance difficult to realistically reproduce. For example, a direct reproduction of the luminance range of a moonless night to the intensity of the sun is technically out of reach. Similarly, the continuous nature of spatial and temporal information does not directly fit to the discrete notions of pixels and frames per second.
The human visual system (HVS) has its own limitations, which to certain extent reduce the requirements imposed on display devices. For example, through a luminance adaptation process (that can be extended in time) human eyes can operate both in dark-night and sunny-day conditions, however, simultaneously only four to five log10 units of luminance dynamic range can be perceived at once. Similarly, the limited density of photoreceptors in the retina (in the foveal region the size of cones amounts to 28 arcsec) as well as imperfections in the eye optics limit the spatial resolution of details that can be perceived. In the temporal domain, the critical flickering frequency (CFF) limits the ability to discern temporal signals over 60 Hz.
All such HVS-imposed limitations are taken into account, when designing display devices, but still a significant deficit of reproducible contrast, brightness, and spatial pixel resolution can be observed, which fall short with respect to the HVS capabilities. Moreover, unfortunate interactions between technological and biological aspects create new problems, which are unknown for real-world observation conditions. For example, the conflict between the eye accommodation adjusted to the display screen and the eye-ball vergence driven by depth (disparity) reproduced in three-dimensional (3D) stereo displays imposes limitations on the depth range that can be comfortably observed. Also, “frozen in time” discrete frames (for LCD displays, for instance) result in perceptual issues. While the entire sequence might appear smoothly animated, each frame is actually static for a short period of time. When the eye tracks dynamic objects (to keep their steady projection in the fovea), the static image is traversed smoothly and values crossed by the eye start to integrate on the retina, which results in a perceived hold-type blur. Note that such blur does not exist in the physical space (that is, in displayed images), but is created in a perceptual space. Nonetheless, hold-type blur can degrade the impression of perceived image quality in a similar way as physical blur introduced to images.
This chapter refers to perceptual effects, rather than to physical effects, which can be experienced but not measured physically. In particular, it aims at the exploitation of perceptual effects to help overcome physical limitations of display devices in order to enhance apparent image qualities. Section 15.2 shows how the perceived image contrast can be improved by exploiting the Cornsweet illusion. Section 15.3 introduces glare effect and shows how it can be used for brightness boosting. Section 15.4 presents techniques for reducing the negative impact of some perceptual effects, such as hold-type blur. It shows how high-quality frames can be interleaved with low-quality frames, still improving the overall appearance. Afterward, Section 15.5 demonstrates how the high quality of all frames can improve apparent spatial resolution. Section 15.6 discusses the role of perception in the context of stereovision and accommodation/vergence conflict reduction. Finally, this chapter concludes with Section 15.7.
15.2 Apparent Contrast Enhancement
Image contrast is an important factor for image perception. Nonetheless, there is usually a mismatch between the optical contrast of the displayed image and the real world due to the contrast limitations of typical display devices. Fortunately, humans, nonetheless, have the impression of a plausible real-world depiction when looking at images on a computer screen, despite the far lower luminance and contrast ranges in comparison to reality. So, the key issue for image reproduction is to allocate a sufficient contrast for a plausible reproduction of all important image features, while preserving the overall image structure [1]. The amount of allocated contrast influences the discrimination and identification of the objects depicted in the image, which are important factors for image quality judgments [2]. Numerous psychophysical studies show a clear preference toward images with enhanced contrast often by 10–20% with respect to their original counterparts [3], [4].
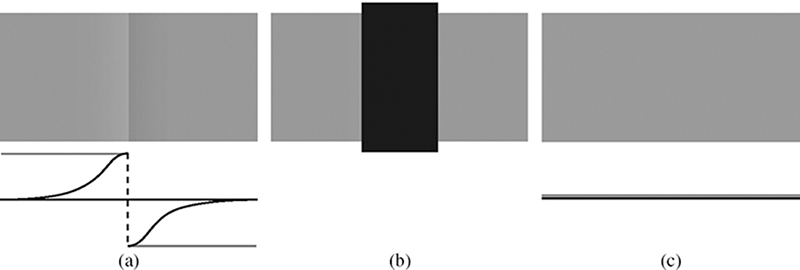
FIGURE 15.1
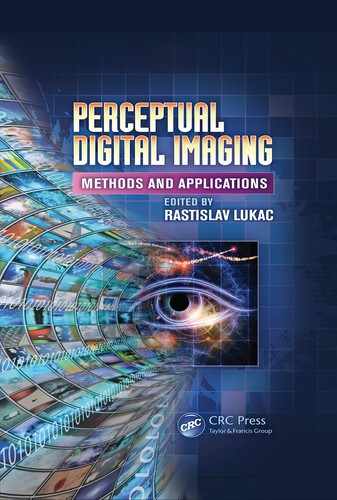
Cornsweet illusion. (a) By imposing the so-called Cornsweet luminance profile (as depicted by the black plot below), onto the center of isoluminant bar, a lightness illusion is created that the left bar side is brighter than the right one (as depicted by the gray plot). (b) By occluding the Cornsweet profile with the black rectangle the lightness of visible bar parts becomes the same, as one could expect for the isoluminant bar shown in (c).
Existing tone mapping and color grading operators are usually quite efficient in allocating an available dynamic range to reproduce image details and to preserve a certain overall image appearance. However, global contrast must often be traded off when texture details are faithfully reproduced. Conversely, preservation of contrast relations between major image components require a local contrast reduction that leads to a loss of small-scale information. Since physical contrast manipulations reach a dead end in such conditions, the question arises: Can the perceived contrast be enhanced?
Contrast perception is a far more complex phenomenon than accounting for physical contrast [5]. The eye’s adaptation plays an important role, just like the display’s luminance levels, ambient lighting, and spatial frequencies of the contrast signal [6]. While one can mostly reliably predict the influence of global adaptation, spatial-vision effects, which arise from intensity and color patterns created by neighboring pixels, are not easy to model [5]. This fact makes perceived contrast difficult to quantify in isolation from the actual image content because simultaneous contrast and Mach-band effects appear. While these effects are well known, their interactions can be complex and their controlled use to enhance apparent contrast has not yet been shown.
In this respect the Cornsweet perceptual illusion [7] is far more promising as it enables contrast enhancement along edges [8]. The illusion is created by introducing a pair of gradient profiles that are gradually darkening and, on the opposite side, lightening toward the common edge. At this edge they result in a sharp shading discontinuity, as shown in Figure 15.1. The lightness levels on both sides of the discontinuity are propagated through some filling-in mechanisms of human perception [9]. While this process is not fully understood, it is likely to be similar to image restoration processes that take place in the retinal blind spot where the optic nerve exits from the eyeball, and, for dark conditions, in the foveal blind spot due to the absence of foveal rods. The luminance propagation of the Cornsweet perceptual illusion creates the impression of a lightness step function, even though the gray levels on both sides match physically and do not actually correspond to a step function. Note that to trigger such an effect, one would usually need to introduce a physical contrast in form of a luminance step function, which would then require a certain dynamic range. For the Cornsweet perceptual illusion, the gradient profiles (called further the Cornsweet profiles) gradually tend to the original luminance levels on both sides of the edge, hence, the apparent contrast is produced without any extra use of dynamic range.
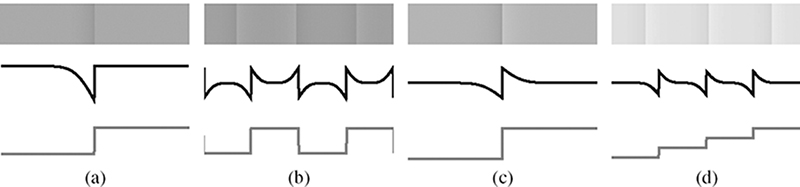
FIGURE 15.2
Different luminance profiles, which create the Craik-Cornsweet-O’Brien illusion: (a) Craik O’Brien, (b) missing fundamental, (c) Cornsweet, and (d) repeated Cornsweet.
The illusion can also be achieved by inserting the Cornsweet profile into uniform luminance regions, as shown in Figure 15.1; it is even more interesting that the profile can be added to existing edges to boost their apparent contrast even further. In the latter scenario, skillfully inserted Cornsweet profiles affect the image appearance relatively little, as they contribute to a desirable apparent contrast enhancement at the edge, but do not produce additional sharp contrast patterns or ringing, as they gradually vanish. Obviously, when exaggerated, such profiles can create an infamous halo effect as discussed in the context of tone mapping, so an important issue is to control their strength. In art, adding such profiles along important lines and silhouettes is usually referred to as countershading [10].
In fact, a whole family of profiles similar to those shown in Figure 15.2, which are often called by the names of their inventors, can be used to trigger the apparent contrast illusion [7]. For example, the one-sided Craik-O’Brien profile is extremely useful to enhance image contrast in the proximity of saturated (clamped) image regions, where there is not enough dynamic range to use a fully symmetric Cornsweet profile.
Technically speaking, the Cornsweet profile can be generated by subtracting from the original image Y its lowpass version Yσ obtained by means of Gaussian blurring. Then by adding back the difference U = Y − Yσ to Y as:
the resulting image Y′ has its contrast perceptually enhanced. This procedure is equivalent to the well-known image processing technique called unsharp masking [11], which is commonly used to sharpen image details (hereby, the apparent contrast increases as well [3], [12]). Unsharp masking produces Cornsweet profiles and, hence, its perceptual effect can be explained by the Cornsweet illusion [13].
While for naive unsharp masking the same amount of high frequencies is added to the whole image, one can imagine an adaptive procedure, where detail contrast is enhanced only in those regions, where the texture visibility is reduced. Reference [14] proposed a multi-resolution metric of local contrast, which detects feature loss in tone-mapped images with respect to a high-dynamic range reference and drives the spatial extent and the strength of Cornsweet profiles (Figure 15.3).
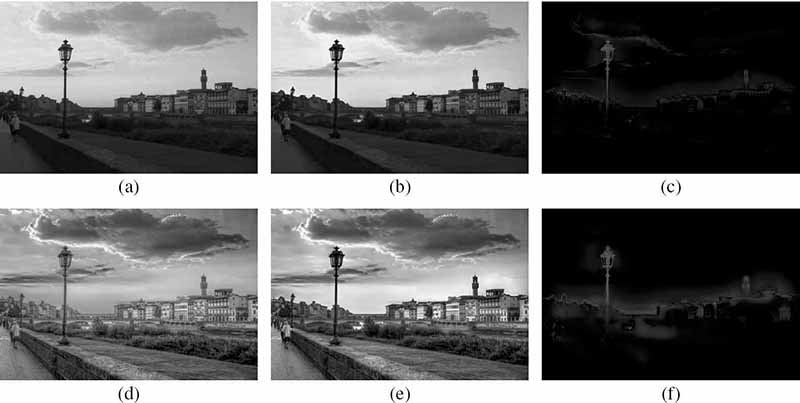
FIGURE 15.3 (See color insert.)
. Two examples of how the Cornsweet illusion can enhance the contrast of tone-mapped images are presented on the left. (a–c) Example processed using a global tone mapping operator, where countershading restores contrast in the heavily compressed dynamic range of the sky and highlights. (d–f) Example processed using a local tone mapping operator, which emphasizes on local details at expense of losing global contrast between the landscape and sky. In this case countershading restores brightness relations in this starkly detailed tone mapping result. Notice that the contrast restoration preserves the particular style of each tone mapping algorithm.
Although the Cornsweet illusion is the most effective for the luminance signal, it can also be applied to chromatic channels. For example, one can measure the loss of contrast in luminance, while the corrective signal U affects chroma. Chroma enhancement strengthens the image colorfulness, and it turns out that increasing the original chroma values by 10% to 20% usually results in a preferred image appearance [15]. Reference [16] experimented with the introduction of the Cornsweet profile into the chroma signal to enhance the overall image contrast (Figure 15.4).
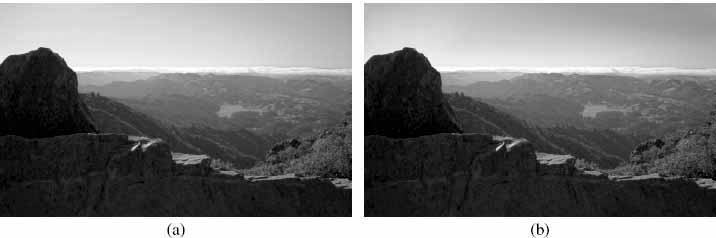
FIGURE 15.4 (See color insert.)
. The Cornsweet illusion used for color contrast enhancement: (a) original image and (b) its enhanced version using Cornsweet profiles in the chroma channel. In this example, the higher chroma contrast improves the sky and landscape separation and enhances the impression of scene depth.
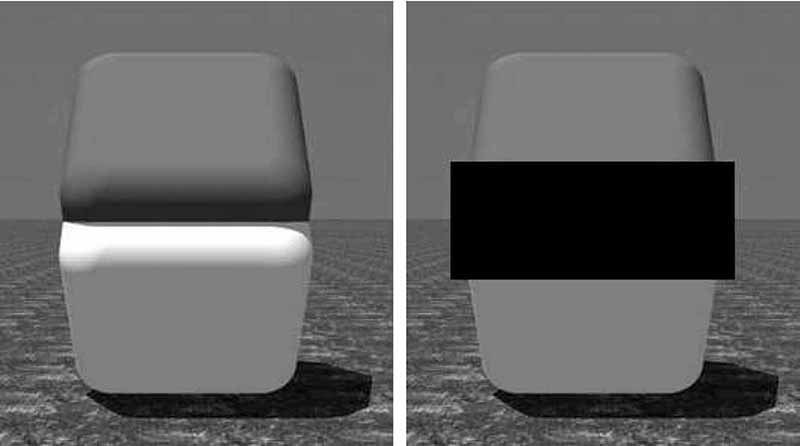
FIGURE 15.5
The Cornsweet effect strength in 3D scenes. Brightness of the bottom cube’s wall looks different in these two images which differ only in the presence of black rectangle that occludes the Cornsweet profile [9].
Countershading has proved to be also useful in other applications, such as color-to-gray image conversion, where the dimensionality reduction from the usual three color channels into one achromatic channel may lead to an information loss. The lost chromatic contrast can be restored by adding the Cornsweet profiles into the achromatic channel [17].
In 3D graphics, other signals can be used to produce countershading profiles, for example, image depth [18]. Also, as discovered in Reference [9], the apparent contrast enhancement is significantly stronger when Cornsweet profiles are consistent with the scene lighting, undergo correct perspective foreshortening, and respect other cues resulting from 3D scene interpretation. Figure 15.5 shows an example where the apparent contrast enhancement was increased by 167% with respect to a standard two-dimensional Cornsweet profile, as reported in Reference [9]. Motivated by this observation, Reference [19] proposed a 3D unsharp-masking technique, where the Cornsweet profiles are created directly in object space over the outgoing reflectance function. In this way, the depiction of various visual cues can be enhanced, including gradients from surface shading, surface reflectance, shadows, and highlights. These modifications lead to an improved overall image appearance and eases the interpretation of the 3D scene. Figure 15.6 shows an example of an image that was enhanced using 3D unsharp masking, where the Cornsweet profile was inserted at the shadow boundary and deepens the blackness impression. At the same time enough dynamic range is left (it is not completely black) in the shadow, so that the text on the opened book page remains legible.
In summary, contrast enhancement in displayed images is an important factor toward a better reproduction of real-world contrast ranges, and it leads to an overall preferred image appearance. By relying on apparent contrast enhancement by means of the Cornsweet illusion, the often contrast-limited displays can reach new levels. This effect was demonstrated for two-dimensional images or with an even stronger effect for 3D rendering. The Cornsweet illusion profiles can be introduced into achromatic (luminance) or chromatic channels to improve channel-related contrast deficits. Interestingly, this observation even opens up the road for other applications, such as color-to-gray conversion, where chromatic contrast in isoluminant regions is reproduced in the achromatic channel. Section 15.6 demonstrates another incarnation of the Cornsweet illusion that is used to enhance the impression of perceived depth by modifying the visual disparity signal.
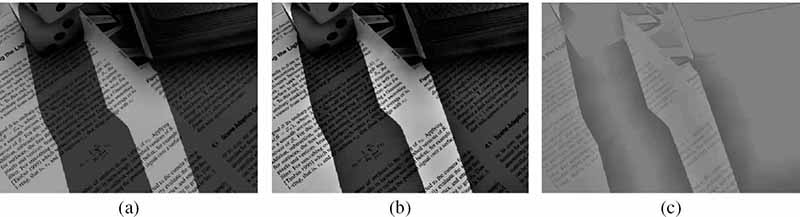
FIGURE 15.6
3D unsharp masking: (a) original image, (b) enhanced image, and (c) the corresponding correction signal U′ but computed and added to the surface shading in the 3D object space. ©ACM, 2008.
15.3 Apparent Brightness Boost

FIGURE 15.7
The human eye anatomy [22]. Notice opaque particles suspended in the lens and vitreous humor, which create the ciliary corona pattern due to light scattering, as shown in Figure 15.9. The right inset shows the lens structure with fiber membranes in the lens cortex, which act as a diffraction net and are responsible for the lenticular halo effect. ©The Eurographics Association 2009.
This section discusses the problem of brightness enhancement by capitalizing on optical imperfections of the human eye, depicted in Figure 15.7. Every real-world optical system is affected by a certain amount of reflected and scattered stray light, which causes the contrast reduction due to a veil of luminance in the proximity of bright light sources and highlights. This usually unwanted effect is called veiling glare or simply glare, and it occurs when bright objects are present in the field of view. In particular, in night scenes such scattered lighting may dominate at certain regions of the human eye retina. One may recall from the night driving experience how difficult is to read the registration plate of an approaching car while being exposed to its beam lights.

FIGURE 15.8
It is not necessary to have physical light sources to evoke the impression that an object is self-luminous, as can be seen in (b) and (d). Painting halo (luminance gradients) around objects enhance their brightness or even creates an impression of glow without the actual light emission. Interestingly, the same surface representations without such luminance gradients cannot trigger the self-luminosity impression, and instead are perceived as reflective, as can be seen in (a) and (c). Redrawn from Reference [21].
The human eyes are prone for glare effects due to structural shape imperfections of optical elements and the presence of various particles suspended in the lens and vitreous humor. Of particular interest is synthetic rendering of typical veiling glare patterns in images, which are somehow interpreted by the human brain as caused by the real presence of bright objects and lead to the so-called glare illusion. It turns out that when a veiling pattern is painted around nominally bright objects in the image, this illusion makes them appear brighter. Since the levels of luminance required to naturally trigger the glare effects in the eye cannot be achieved using traditional display technology, such glare patterns, painted directly in the images, improve the impression of realism. Moreover, even the effect of glowing caused by the introduction of smooth gradients around bright objects can be easily obtained [20], [21], as illustrated in Figure 15.8. Such gradients have been used by artists for centuries to improve the apparent dynamic range of their paintings, and it is just as attractive today in a digital imaging context.
A typical glare pattern for a small light source, as perceived by most subjects with normal eyes, is depicted in Figure 15.9. Two major component can be distinguished in the glare pattern [23], [24]: bloom, which refers to a general loss of contrast in the proximity of bright objects (veil), and flare, which comprises the ciliary corona (the sharp needles) and the lenticular halo. Some people report temporal changes in the glare appearance, such as a pulsation of the glare intensity and flickering of the fine needles in the ciliary corona [22].
The majority of existing approaches to computer-generated glare, while inspired by the knowledge about the human eye anatomy and physiology, are based on phenomenological results rather than explicit modeling of the underlying physical mechanisms. A common approach is to design convolution filters, which reduce image contrast in the proximity of glare sources by effectively adding luminance gradients around bright regions patterns similar as in Figure 15.8. In Reference [24], the authors base their filter on the point-spread function measured for the optics of the human eye [25], [26]. A set of Gaussian filters with different spatial extent, when skillfully applied, may lead to very convincing visual results as well. This approach is commonly used in computer games [27]. A recent perceptual study [28] has shown that the impression of displayed image brightness can be increased by more than 20% by convolving high-intensity pixels in the image with such simple filters.

FIGURE 15.9
The glare appearance example [22]. ©The Eurographics Association 2009
Other glare effects, such as the ciliary corona and the lenticular halo, are often designed off-line and placed in the location of the brightest pixel for each glare source as a billboard (image sprite) [29], [24]. However, using billboards, it is difficult to realistically render glare for glare sources of arbitrary shape and non-negligible spatial extent.
Recently, References [30], [31], and [22] investigated the application of wave optics principles to glare modeling, considering various obstacles causing light scattering on its way from the pupil to the retina, as shown in Figure 15.7. Reference [31] investigated the role of small particles randomly distributed in the lens and floating in the vitreous humor in creating the ciliary corona pattern, as originally suggested in Reference [23]. Regularly spaced fiber membranes in the lens cortex act as the diffraction grating which produces lenticular halo [23], [29], [24]. Reference [22] considered the dynamic aspect of glare, observing that the pupil size, the shape of lens, and particle positions change in time.
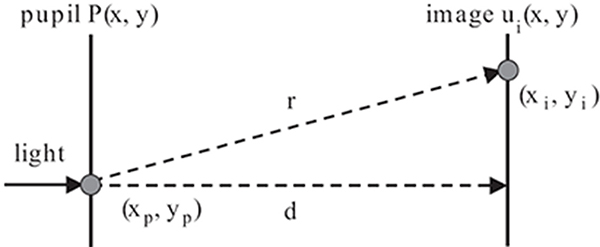
FIGURE 15.10
A simplified scheme of optical system in the eye used for wave optics simulation of light scattering in the eye [22]. ©The Eurographics Association 2009.
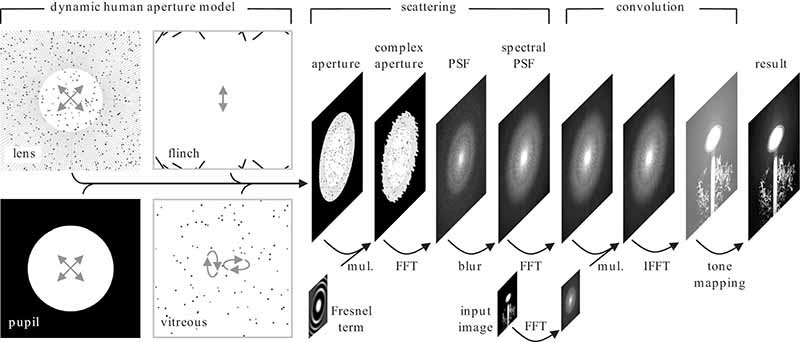
FIGURE 15.11
Methods The glare computation pipeline, where the black arrows indicate GPU shaders that transform input texture(s) into output textures [22]. ©The Eurographics Association 2009.
It turns out that under a simplifying assumption that all these opaque light scattering obstacles are orthographically projected onto a single plane aperture Figure 15.10, a simple wave-optics model can be derived. Essentially, the model boils down to taking the Fourier transform ℱ of the pupil aperture function P(xp,yp), and computing its squared value |ℱ {P(xp,yp)}|2 to derive the point-spread function (PSF) for this aperture. Then it is enough to convolve the input high-dynamic range image with the PSF to obtain a glare image. More formally, the Fresnel approximation to Huygen’s principle [32] for the optical system depicted in Figure 15.10 under the assumption of homogeneous incident light of unit amplitude is given by
where (xi,yi) denotes the coordinate at the retina plane, λ is the wavelength of the light, and d is the distance between the pupil and the retina. The pupil aperture function P (xp,yp) gives the opacity of each point in the pupil, with zero opacity values denoting transparent and ones denoting opaque attributes. The Fourier transform ℱ is computed at the grid of points .
Figure 15.11 summarizes the computation process that is performed in real time using recent graphics hardware. Namely, the high-resolution opacity image is composed from the images representing the pupil aperture, the lens diffraction grid (at the lens cortex) and particles, the eyelashes, and particles in the vitreous humor (obviously other light scattering elements can be considered as well). The resulting aperture function P (xp,yp) is multiplied by the imaginary Fresnel term E (xp,yp), as in Equation 15.2. Then, the fast Fourier transform (FFT) is performed over the resulting complex aperture, and the PSF for a single wavelength is computed. By rescaling the PSF for different wavelengths (refer to Reference [22] for more details) and summing up all resulting PSFs, the spectral PSF is computed. Then, the convolution of the input high-dynamic range image with the spectral PSF is performed in the Fourier domain, where it boils down to a simple multiplication. The inverse fast Fourier transform (IFFT) is performed to obtain the image with glare in the spatial domain, which is then tone mapped and displayed.
Figure 15.12a demonstrates a simple billboard approach on the candle image, where the spectral PSF is just placed at the flame center. Note the differences in the visibility of horizontal needles in the ciliary corona with respect to Figure 15.12b, which is computed using the processing pipeline depicted in Figure 15.11.
In summary, the glare illusion is a powerful tool to enhance the apparent image brightness and create an impression of light emission from the image. Similar observations have been made in the context of lens flares [33], and their simulation can be used to improve the overall perceived image appearance in the same way. The possibility to enhance brightness and to create the impression of light emission is highly desirable when aiming at a more realistic observer experience. As shown in this section, a direct glare simulation based on the principles of wave optics gives a convincing result and it is surprisingly inexpensive in terms of computations.
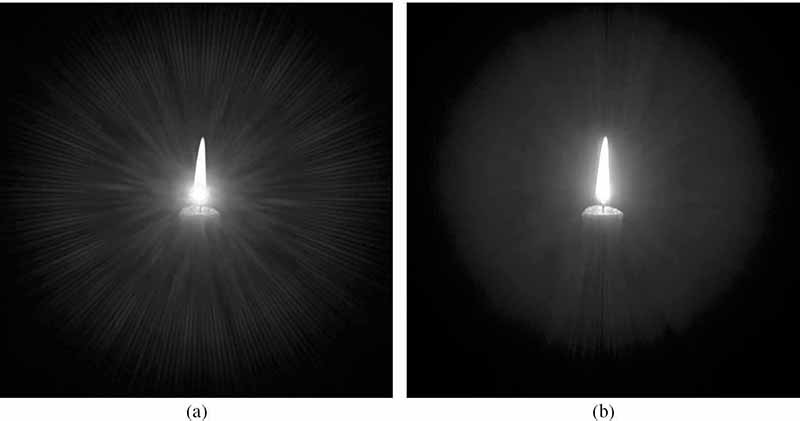
FIGURE 15.12 (See color insert.)
. The glare appearance for a luminous object of non-negligible spatial size [22]: (a) the light diffraction pattern (point-spread function) is just imposed on the background candle image, (b) the light diffraction pattern is convolved with the image. ©The Eurographics Association 2009.
15.4 Image Temporal Resolution Retargeting
The continuous demand for better-quality displays results in a huge development in the display industry. Attempts of creating mini-cinemas at home and/or visualization centers lead to the production of bigger screens. At the same time viewers tend to move closer to their displays in order to enjoy fine details of visualized content. Therefore, today’s new designs – apart from improved contrast and brightness – need to ensure that the spatial display resolution is sufficient to convey a high-quality image appearance. This section will show that temporal aspects (that is, frame rate) can have a huge impact on the perception of spatial resolution.
Under standard conditions, the world is perceived as a crisp and sharp mental image. However, under certain conditions, the visual percept is blurred, which suggests that the human visual system indeed is a time-averaging sensor. This usually happens in the case of fast-moving objects, which cannot be easily tracked by the human eye (for example, car wheels or objects behind a fast train window). The blur, respectively, the temporal integration is because that quickly moving objects cannot be stabilized on the human eye’s retina for certain velocities. This phenomena is usually called motion blur and is similar to the situation of taking a picture with a long exposure while objects are moving quickly in front of the camera. It is often assumed that the temporal integration of information by the HVS follows Bloch’s law [34], which states that detectability of stimuli of similar characteristic depends only on their energy, which is a product of exposure time and luminance. Although this law holds only up to a short time duration (˜40 ms), it becomes crucial for displays showing dynamic content, where the time of one frame, assuming 25 frames/s content, is exactly 40 ms. This basically shows that an observer looking at a display does not only perceive what is currently shown but also what was shown and perceived before.

FIGURE 15.13
Illustration of hold-type blur for a ball under translational motion of constant velocity [35]. In the top row, physical reality denoted by six intermediate moments in time is shown. The open circle denote the eye fixation point. As the ball continuously moves and the human eyes perfectly track the ball (SPEM), its image is stabilized on the retina producing a crisp and sharp image. On a hold-type display shown in the middle row, the ball is displayed at the same position for the time period of one frame. However, at the same time, the fixation point will continuously move to smoothly track the ball. Therefore, as the ball’s image on the retina is no longer stabilized, the signal registered on the retina will be blurred along the trajectory of motion, which is shown in the bottom row. ©The Eurographics Association 2010.
The eye integration has a huge influence on the appearance of moving objects on a display. Consider the continuously-moving real object shown in Figure 15.13 and assume that it is tracked perfectly by the HVS. Because of this tracking, a single receptor on the observer’s retina will always receive the same signal over time. The percept is, hence, sharp and crisp. However, in all current display devices, objects are displayed for the time period of one frame at the same position (so-called hold-type effect), whereas the tracking performed by the HVS is continuous due to smooth pursuit eye motion (SPEM). Therefore, in contrast to what is found for real objects, the single receptor considered previously will not receive the same signal over time anymore. Instead, it will average values along the object trajectory resulting in a blurred percept. Note that this so-called hold-type blur is not due to any display limitations. It happens in human eyes, meaning that it is purely perceptual and cannot be captured easily by any camera.
A simple solution to reduce hold-type blur is to reduce the hold time, the period for which the same frame is shown on a display. This requires a high frame rate, which is, in case of broadcasting applications, usually not provided by the original content or too expensive in the case of rendered content. Therefore, many temporal upsampling techniques have been developed to increase the frame rate. Since this field is relevant to both the computer graphics and the display communities, solutions to reduce hold-type blur or to increase frame rate can be categorized in two according groups. The first considers the general problem of temporal upsampling, where solutions are usually implemented using a CPU or dedicated graphics hardware (GPUs). Here, the computation time can usually be traded in for higher quality. The second group is formed by solutions found in television screens, which have to be really efficient even on a low-cost computation units.
15.4.1 Computer Graphics Solutions
In the computer graphics community, a high frame rate is desired as it has a huge influence on animation smoothness, interactivity, and perceived image quality. Because high-quality image generation techniques are very often time consuming, a high frame rate is not always possible to achieve. Therefore, less expensive methods for improving the temporal resolution of the content without scarifying overall quality have been introduced.
One of the first attempts to increase the number of frames in the context of interactive applications was presented in Reference [36]. The method relied on depth information that allowed to reproject shaded pixels from one frame into another, thus creating many frames out of a single originally rendered frame. Similar ideas were exploited in later studies, where very expensive shaded samples were reused to speed up the image generation process. First such methods [37] scattered information from previously rendered frames into new frames by means of forward reprojections. Because of problems with occlusions and gaps that needed to be fixed explicitly, Reference [38] replaced forward reprojection by reverse reprojection, which also better fits common GPU architectures. Instead of pixel colors, one can also reuse computationally expensive intermediate values whose choice can be automated [39]. All these techniques can also been adapted to respect time-varying phenomena [40], which makes them particularly interesting for remote-rendering contexts as well [41]. More details can be found in Reference [42].
Another category of methods that allow for creating additional frames are morphing methods. An extended survey discussing various techniques was presented in Reference [43]. Recently, Reference [44] used content-preserving warps targeting the problem of video stabilization rather than temporal upsampling. However, similar techniques could be used also for temporal upsampling.
There are also methods that directly target the creation of intermediate frames. An example of such a method is presented in Reference [45], where the problem of temporal upsampling of video content has been addressed. The work is well-suited for a single dis-occlusion which allows for producing high-quality results for a standard content. However, it requires full knowledge of future frames and is computationally expensive; therefore, it is not really suitable for real-time applications. Although the quality of additionally created frames is important and can be produced using various methods, such as the one described above, in the case of temporal upsampling not all regions of the image are equally important. Reference [46] showed that high-quality moving edges are a key feature to the HVS. Therefore, any ghosting produced by temporal upsampling methods as well as hold-type blur can significantly lower perceived quality. The same work also proposed a method that addresses those perceptual effects and performs temporal upsampling, which preserves a high edge quality.
15.4.2 Industrial Solutions in Television Sets
Although the problem of temporal upsampling is well studied in computer graphics and many methods providing good quality have been developed, most of them are computationally expensive. Therefore, such solutions cannot be easily implemented as computational units manufactured for television screens. As the problem of hold-type blur is a widely known issue in the display industry, many off-the-shelf television sets nowadays offer solutions that are designed to reduce blur, but do not require much computational power. The key idea is, to increase the frame rate, usually to 100 or 200 Hz (respectively, 120 and 240 Hz for NTSC content), by introducing intermediate frames produced internally from a low frame rate signal. The following shortly summarizes existing solutions while an extended survey can be found in Reference [47].
The simplest solution is black data insertion (BDI), which reduces the hold-type effect by introducing new black frames interleaved with the original. This is similar to the way old cathode-ray tube (CRT) displays work; the light is emitted only for a small fraction of the frame time. However, this solution has some drawbacks and limitations. Similarly to classic CRT displays, it can significantly reduce brightness or introduce temporal flickering, especially in large bright areas, where the HVS temporal sensitivity is high.
Instead of inserting black frames other solutions turn the backlight of an LCD panel on and off, a procedure called backlight flashing (BF) [48], [47]. This is possible because in many available displays, LCD panels are illuminated using hundreds of LEDs, whose response is very fast. Therefore, it is easy to flash them at frequencies as high as 500 Hz. Note that this solution has similar drawbacks to that of BDI methods. Besides hold-type blur reduction, such techniques are also useful for reducing the effect of long LC response by turning on the backlight only at the moment when the desired state of the LCs is reached.
The problems of black data insertion methods can be overcome by using the original frames, that are duplicated and blurred, instead of black frames. On the other hand, this blurred frame insertion (BFI) solution [49] can cause visible ghosting since the blurred frames are not motion compensated.
Another category of methods reducing hold-type blur is frame rate doubling (FRD). For such solutions, additional frames are obtained by interpolating pairs of original frames along their optical flow trajectories [50]. Such techniques are commonly used in current television sets, where they can easily expand standard 24 Hz content to much higher frame rates (for example, 240 Hz) without reducing brightness or introducing flickering problems. The biggest limitation of frame interpolation comes from the optical flow estimation. While it is usually not a problem for objects that are moving slowly, optical flow estimation algorithms tend to fail when velocity gets bigger. As reported in Reference [35], in such situations, the optical flow is automatically deactivated and the original frames are simply duplicated, hereby, lowering the frame rate to the original, but avoiding visible errors. Such problems are because that the optical flow estimation problem is usually very complex and time consuming. Because all algorithms in television sets must be very efficient, they generally tend to show difficulties for challenging cases. Another drawback of using interpolation is the time lag introduced by the need of knowing the future frames in order to create intermediate frames. This is usually not a problem for broadcasting applications; however, in scenarios where a high interactivity is needed (for example, video games) the lag in interaction even beyond 90 Hz can be detected by the user and result in discomfort [35], [51].
Instead of increasing the frame rate, a software solution for reducing the hold-type blur is to apply an image filter to the content to be shown on the screen, that aims to invert hold-type blur. This technique is called motion compensated inverse filtering (MCIF). As hold-type blur can be modeled in image-space by a local one-dimensional convolution kernel oriented in the direction of the optical flow, a deconvolution technique can be used in order to inverse this process. In practice [52], it boils down to applying a local sharpening filter, which is computed according to the local optical flow. The effectiveness of such a technique is limited by the fact that hold-type blur is a lowpass filter, which removes certain frequencies. Therefore, none of those frequencies that are completely lost can be restored. Only those that are attenuated by hold-type blur can be recovered by amplifying them beforehand using linear filtering.
There exists a possibility to combine several methods described above; for example, the in-between frame derivation based on optical flow with the backlight flashing. However details on such custom solutions are not published.
15.4.3 Perceptually Motivated Temporal Upsampling for 3D Content
The solutions described in the previous section can be used for hold-type blur reduction and come either from the computer graphics community or television industry. Solutions from the first group are able to provide high-quality results at the expense of a high computational cost; therefore, depending on the complexity of the rendering, the achievable frame rate can be limited. Solutions from the second group are usually implemented as small chips in television sets, are well suited for real-time application (for example, broadcast content) but offer limited quality. The quality loss is because such solutions are limited to the information found in the signal that is immediately displayed. Therefore, additional information, such as optical flow, needs to be recovered in order to create in-between frames. However, this step usually introduces visible artifacts since correct data cannot be obtained. Fortunately, in the case of synthetic content, such information is in fact available. The most common example is 3D rendering, where perfect optical flow, often needed for other purposes (for example, motion blur), can be computed very efficiently.
Reference [35] presented a method, which performs temporal upsampling for computer generated content by exploiting information available during 3D rendering and various aspects of the human perception. This method produces quality similar to that by solutions designed for computer graphics applications (Section 15.4.1), but at a low computational cost usually required in current industrial real-time solutions (Section 15.4.2). Another advantage of this method is that it performs extrapolation instead of interpolation, and hence, it does not produce any additional time lag. To this end, the method achieves tradeoff between the single additional frame quality and the cost of its production by exploiting human perception.
In contrast to the previously described computer-graphics solutions, this method targets temporal upsampling from frame rates that are already relatively high. Namely, extrapolation was demonstrated from 40 Hz to 120 Hz signals, although the idea can be extended to even higher frame rates. The pipeline of the method is presented in Figure 15.14.
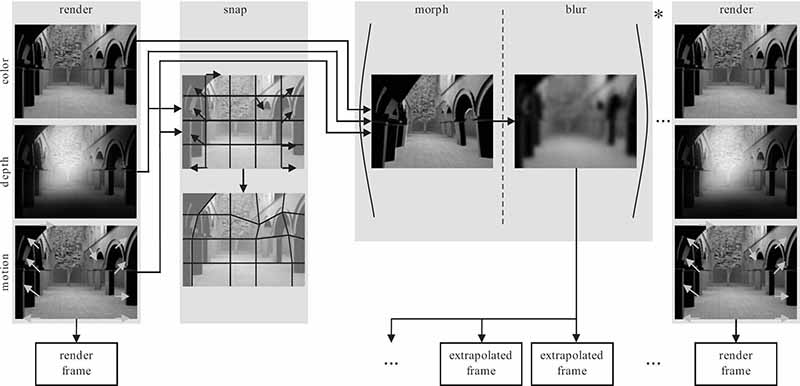
FIGURE 15.14
The pipeline of the temporal upsampling method from Reference [35]. From left to right; to extrapolate one or more additional frames, first a grid is created with vertices snapped to geometry discontinuities. Later the grid is used to morph the originally rendered frame into multiple in-between frames. These are later blurred in order to hide artifacts where morphing failed, for example, at disocclusions. Finally, the high-frequency losses are compensated for by frequency enhancement in the original frame.
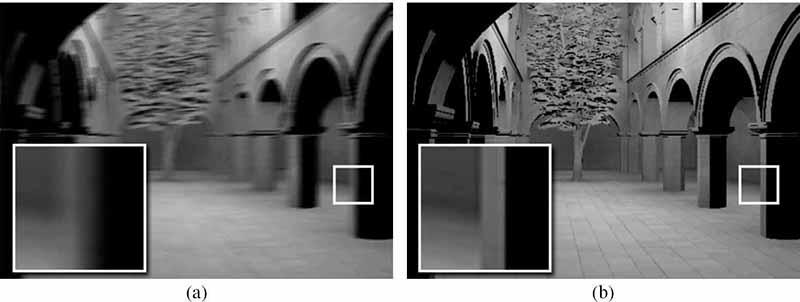
FIGURE 15.15
Simulation of the blur perceived when the same sequence is played at (a) 40 Hz and (b) 120 Hz. Notice how the horizontal blur (hold-type effect), along the motion trajectory, was reduced. The simulation comes from a user adjustment task where the level of blur in the presented images was matched with the blur perceived in played animations [35]. ©The Eurographics Association 2010.
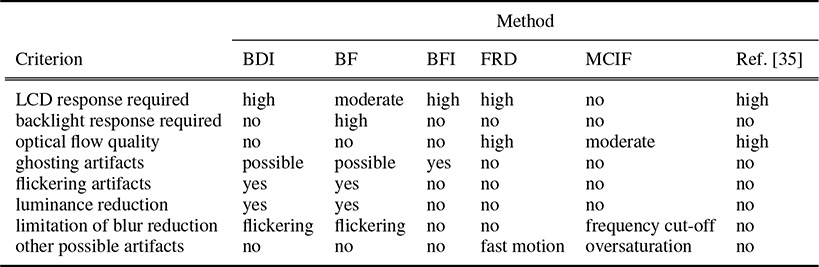
As the method is meant to work at a high frame rate, the time budget for the additional frame computation is very low. The method first performs a fast and rough approximation of the additional frames based on the knowledge of the past. This is achieved by extrapolating the current original frame using a mesh-based approach. First, a coarse grid is attached to the original frame. This grid is then morphed, according to the optical flow that is obtained from the rendering pipeline, by translating each vertex of the grid by the vector of the optical flow that corresponds to the location of the vertex. While the grid is deformed also the underlying textures are morphed according to the optical flow. In the scenario of upsampling 40 Hz content to 120 Hz, this technique was used to produce two predicted frames. The low time consumption comes from the fact that morphing a coarse grid along with a texture is relatively inexpensive using current GPUs. Unfortunately, this comes at the expense of possible artifacts that can appear on discontinuities of optical flow (geometry). In order to suppress and hide them two solutions were proposed. First, to prevent big drifts on geometry edges, vertices of the grid are snapped to geometry discontinuities before the morphing. Although this aligns the grid with geometry well, small artifacts can persist as the grid is too coarse to handle small geometric details. To improve the result further, the time-averaging property of the HVS is used. The extrapolated frames are blurred in order to avoid such artifacts. The resulting high-frequency losses are compensated for in the original frames that are, by definition, perfect. Because of the time averaging property of the HVS, the perceived images are composed to the desired animation. However, the compensation is not always feasible, particularly in high contrast regions. A black object that is brightened by the blur would need a negative compensation, which is physically impossible. In such places, the blur can be reduced, especially if artifacts are unlikely to be visible. An example, how such a technique can reduce the hold-type effect, is shown in Figure 15.15. Table 15.1 compares the perceptually motivated temporal upsampling technique to other techniques used in television sets described previously in Section 15.4.2.
This section showed that the temporal integration ability of the human visual system has a significant impact on the perceived image quality. A low frame rate is the reason why objects moving on a hold-type screen are perceived as less sharp and crisp. The presented techniques reduce this problem and achieve a higher apparent visual quality using different temporal upsampling strategies or inverse filtering. It was also shown that the limitations of the HVS imply that not all frames need to be perfect. The latter can be exploited to make solutions more efficient. If performance is not an issue, one can even turn these HVS deficiencies to an advantage; as shown in the next section, carefully computed high-quality frames can even allow for the improvement of image quality (in terms of resolution and color depth) beyond the physical properties of a display.
TABLE 15.1
Comparison of the various methods.
15.5 Apparent Color and Resolution Enhancement
While hold-type blur leads to an objectionable reduction of perceived image quality, the fact that the eye integrates information over time can be turned into an advantage. The following describes two examples, that is, the increase of color and resolution, which allow enhancement of content appearance by exploiting the HVS.
The techniques presented here rely on the temporal effects. This idea can be illustrated on a prominent example of DLP projectors. These devices display the three color channels of an image independently, but in rapid succession. These mono-colored images are integrated in the eye and then lead to the impression of a full-color image.
Ideas similar to the DLP projector principle were also exploited in the early days of computer graphics and video games. The available color palettes were often limited and only a few could be used simultaneously. By making use of temporal effects, it is possible to virtually lift these constraints slightly. The idea is to flicker different colors that then integrate in the eye to a new mix that was not previously available.
For example, in a video game, one might want to add a shadow to the scene. To simulate such a shadow, one would usually rely on a darkened version of the affected pixels, yet, the necessary darker tints were not always available in the palette. To overcome this limitation, one could draw the shadow only in one out of two frames, resulting in a flickering shadow. If the refresh rate is high enough to exceed the critical flickering frequency (CFF) [53], the affected colors start to mix with the black of the shadow, hereby, leading to an apparent extension of the available colors.
Similar principles are also used in LCD screens under the name of frame rate control. In fact, many devices are limited to 6 bits per color channel, while the graphics card usually sends 8-bit color information per channel. Many screens exploit a simple technique to display the different nuances, which otherwise would be lost. Whenever a color is not representable by 6 bits, the screen displays its immediate color neighbors in quick succession over time [54]. Hereby, the apparent bit depth is effectively increased because the eye integrates the information and reports an average value to the brain.
The color impression is not the only feature that can be improved by exploiting the temporal domain. Resolution can also be enhanced to produce details that physically cannot be displayed on a screen. Such a possibility is of high interest because today’s image content becomes increasingly detailed. There is an often striking difference between the resolution that a camera uses to record an image and the number of pixels that can actually be shown on a display device. Gigapixel images are no longer uncommon, but displaying them in full detail is a challenge.
In order to increase the apparent resolution of an image, it is again possible to make use of perceptual solutions. As explained in the previous section on hold-type blur, the eye integrates neighboring pixels when moving over the screen to track dynamic content. This effect would, for a static image, lead to an image blur that reduces the overall quality. On the other hand, if the display frequency is increased and the image does no longer appear static, the information perceived during the eye trajectory changes rapidly. Consequently, the information that is integrated in each photoreceptor of the eye can vary drastically. By choosing appropriate temporal color patterns, one can produce an illusion of a high-resolution image by stimulating each receptor in an appropriate way.
The precise setup, recently presented in Reference [55], is as follows. The goal is to display a single high-resolution image (animations will be discussed later) on a low-resolution screen. The idea is to move this high-resolution image slowly across the screen. The observer will track this image and the smooth pursuit eye motion will fixate image points at their corresponding position on the retina. As the movement is perfectly smooth, the eye photoreceptors will integrate the time-varying information in each pixel over a short period of time (Figure 15.16a). As explained before, this integration time is related to the CFF. For example, consider the CFF of 40 Hz; consequently, on a 120 Hz display, three frames are integrated together. In other words, if the eye tracks a point, it will constantly project to the same photoreceptor on the retina; hence, the receptor will perceive three temporal value changes besides the changes when moving from one pixel to the next.
Mathematically, if a receptor moves over an image I (which varies in its pixels and over time) during a duration T that conforms with the CFF along a path p (t), the perceived result is
When tracking across the screen, retinal photoreceptors switch pixels of the low-resolution device at different time steps, which, in combination with the temporal changes of the image content, results in a sufficient variance of the perceived information to create the illusion of looking at a higher-resolution screen (Figure 15.16b).
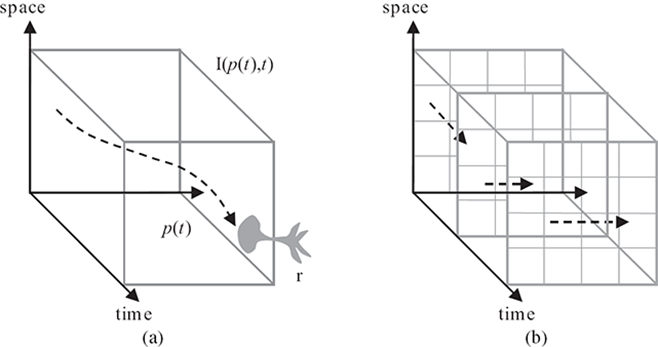
FIGURE 15.16
Perceived integration of an animated image: (a) the continuous case, where an animated image I (p(t),t) is perceived by a receptor r moving along a continuous path p (t), and (b) the discrete case, where an animated image consists of discrete pixels at discrete frames of time with a discrete motion in every frame.
One important observation from Equation 15.4 is that the eye movement is crucial in order to enhance apparent resolution. The reason becomes clearer when looking at a given time t0, as I (p(t),t0) is constant for all receptors inside of a pixel. Consequently, the same color sequence would be perceived and hence, the same integrated response will be reported. The image on the retina corresponds thus to a low-resolution image.
Interestingly, although Equation 15.4 looks continuous, the change of the frames (assuming a CFF of 40 Hz, three frames will be integrated) and the pixels are discrete. Thus, the integral becomes a weighted sum with the weights proportional to the time for which a pixel’s color is seen by the photoreceptor:
Formally, a weight wi,j,t, where i and j refer to a discrete pixel position and k the discrete time interval during which the pixel’s color is constant, is computed as
where χ describes a characteristic function. Namely, χ(i,j)(p(t)) equals to one if p (t) lies in pixel (i, j); otherwise, it is zero. The term χk(t) denotes a characteristic function according to the time interval. In this step, one underlying assumption is that the temporal integration on the retina corresponds to a box filter in the temporal domain, further, time variation of the pixel colors is assumed to be produced instantaneously.
So far, only a single photoreceptor was considered. In Reference [55], the authors assumed that the these receptors are arranged on a uniform grid and hence, that each photoreceptor is actually located on a pixel of the high-resolution image. If the illusion of a higher-resolution image is to be reproduced, each photoreceptor should then perceive an integrated response according to Equation 15.5 that is close to the value of its corresponding high-resolution image pixel.

FIGURE 15.17 (See color insert.)
. Resolution enhancement: (a) test images, (b–d) subimages obtained in the optimization process, (e) resolution enhancement via simulation of the images created on the retina once the three subimages are shown on a high frame rate display, (f) Lanczos downsampling as a standard method, and (g) original high-resolution images. Note, that even though the resolution was reduced three times, the presented method was able to recover fine details in contrast to the standard downsampling method.
For each receptor, Equation 15.5 describes a linear relationship. For all receptors, this results in a linear system that one can solve for the image sequence I over time. The solution can be found in a least-square sense. A constrained optimization is often used to assure that the values of I lie in the displayable range. Examples of the resolution enhancement are shown in Figure 15.17.
As the equation models the integration in the eye, one has to make sure that the CFF is respected and the eye properly integrates the information. Reference [55] proposed a postprocessing technique that blends the optimal solution with a low-resolution filtered version. The blending process is spatially varying, according to the predicted CFF, which is strongly scale and contrast dependent [56]. It ensures that the variance in the temporal signal is properly reduced and the integration assured. Consequently, flickering is avoided, but the resolution gain might be slightly reduced.
For general high-resolution animation, such as 3D rendering, an extension was introduced in Reference [57]. Here, the idea is to rely on optical flow (extracted from the movie or 3D scene) to predict the way the eye tracks general information. A novel GPU-based solver, which drastically reduces the computation time, was proposed. These measures lead to higher processing rates, that enable the treatment of general movies.
Overall, the exploitation of the temporal domain offers an interesting opportunity to produce a perceived resolution increase. This improvement has been proven in several user studies that show the superiority of the approach with respect to standard downsampling techniques. The gain in information has been illustrated by producing a font of 2× 3 pixels that remains legible. This latter case illustrates that there is an actual gain in information and not just the illusion of it. In the future, the temporal domain is an important aspect that should be considered when producing image content.
15.6 Apparent Depth Manipulation
Recently, 3D stereo has received much attention in applications, such as computer games, feature films, and television production. Although 3D movies, 3D games, or even first 3D television channels are accessible to a wide range of customers, many challenges exist when aiming to produce stereo content that is perceptually convincing. The previous sections discussed how the knowledge of the HVS helps to improve luminance contrast, brightness, as well as spatial and temporal resolutions, which are important constituents of image quality. This section complements this argument by showing that taking into account the HVS in the context of 3D stereo improves the perceived quality and the viewing comfort of stereo content.
15.6.1 Depth Perception
In reality, the HVS relies on a number of different mechanisms that allow perceiving depth. They are known as depth cues and can be categorized [58] as pictorial (occlusion, perspective foreshortening, relative and familiar object size, texture and size gradients, shadows, aerial perspective), dynamic (motion parallax), ocular (accommodation, vergence), and stereoscopic (binocular disparity). The sensitivity of the HVS to different cues mostly depends on the distance between the observer and the observed objects [59]. The HVS is also able to combine the information coming from different cues even if they contradict each other [58, Chapter 5.5.10]. Recently, both the feature film and the computer game industries have been undertaking considerable effort to introduce binocular disparity (one of the strongest depth cues) into the content they produce. It is introduced artificially by showing different images to the left and the right eye. This strongly affects accommodation and vergence, which are closely coupled and due to the synthetic stimulation easily contradict each other. The problem is caused by the fact that accommodation tends to maintain the display screen within the depth of focus (DOF) that roughly falls into the range of ±0.3 diopters [60]. On the other hand, with increasing screen disparity, vergence drives the fixation point away from the screen plane. This results in a conflict between the fixation point and the focusing point, which can be tolerated to some degree by the accommodation-vergence mechanisms, but at the expense of possible visual discomfort [60] (Figure 15.18). However, even if the problem of depth conflicts would not exist, the HVS is limited in perceiving big disparities. Retinal images can be fused only in a region called Panum’s fusional area, where disparities are not too big and otherwise double vision (diplopia) is experienced. It was also shown that the fusion depends on many other factors, such as individual differences, stimulus properties (better fusion for small, strongly textured, well-illuminated, static patterns), and exposure duration.
Binocular disparity, as one of the most appealing depth cues, can turn flat images shown on a screen into three-dimensional scenes with significantly enhanced realism. Therefore, it is crucial to understand how the HVS interprets this information, and possibly overcome the limitations stemming from using standard 3D equipment. Unfortunately, disparity perception has not yet received as much attention as brightness perception, which is already a well-studied topic, but it is interesting how many properties they share [61], [62], [63]. Sensitivity to disparity and brightness is defined by detection thresholds, which depend on the spatial frequency of depth corrugations and their amplitude. The “u”-shape of the disparity sensitivity function (DSF) is analogous to the contrast sensitivity function (CSF). However, it is shifted and has a peak around 0.3 to 0.5 cpd and a cut-off frequency around 3 to 5 cpd [63]. For brightness it was shown that CSF is an envelope of responses for a number of independent channels that are tuned to different spatial frequencies [64]. Similar conclusions were provided for disparity [65, Chapter 19.6.3]; however, it is not yet clear what the independent channel bandwidth for disparity modulation is, although some estimates suggest one to three octaves. Interestingly apparent depth, similarly to apparent brightness, is also dominated by the distribution of disparity contrasts rather than absolute disparities [61]. All the analogies listed above suggest that disparity and brightness perception undergo similar mechanisms. Therefore, new models, that potentially could handle disparities, can be inspired by already existing work for luminance.
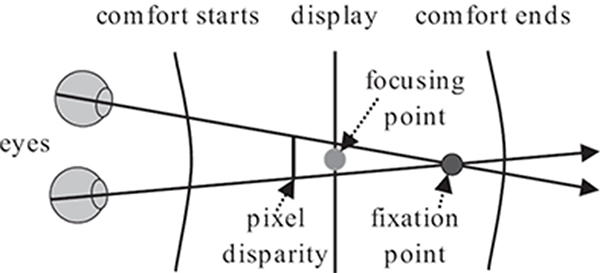
FIGURE 15.18
The problem of discomfort due to the disagreement between accommodation and vergence. When some none-zero disparity is introduced by showing different images to the left and the right eye, the fixation point is driven further from the screen plane, on which the focusing point is located. As the disparity gets bigger the distance between the focusing and the fixation point is increased. This disagreement can be tolerated only to some extent by the accommodation-vergence mechanism, causing discomfort when the fixation point gets too far the screen plane.
15.6.2 Perceptual Disparity Model
There were many attempts to better understand how the HVS interprets depth and how sensitive it is to different cues [59], [65]. It is also interesting how disparity can be reduced in order to increase the viewing comfort [66]. Also many psychophysical measurements were performed to better understand the sensitivity of the HVS to disparities [67], [63], [65]. However, none of them allowed to build a model as complete as the ones available for luminance [64], [68].
Reference [69] recently developed a perceptual model for disparity based on a series of psychophysical measurements that allows for a better understanding of binocular disparity and predicts the response of the HVS to different stimuli. This work was mostly inspired by the existing similarities between brightness and depth perception described in the previous section. The key information needed to build such a model are measurements of disparity detection thresholds. The authors conducted a number of psycho-visual experiments to obtain the thresholds for sinusoidal patterns in depth with different frequencies and amplitudes. This allowed them to fit an analytic function to the obtained data, which describes detection thresholds for a whole range of possible sinusoidal depth corrugations. Such function can be later used for computing a so-called transducer function that maps disparity values to a perceptually linearized space. The transducer function is invertible, therefore changing from physical disparity values into a perceptual space and back becomes possible. This allows for performing all operations on disparity in a perceptually linearized space and take into account the nonlinearity of human disparity perception. As the disparity sensitivity depends on the spatial frequency of the depth pattern, before applying the transducer function, a disparity map needs to be decomposed into frequency bands and all operations have to be performed separately on each band.
Reference [69] showed a number of possible applications of the model. One of them is a disparity metric which allows for comparing two stereo images. Given an original disparity map and a distorted one, it computes a spatially varying map of perceived disparity distortion magnitudes. Both disparity maps are first decomposed into frequency bands and later transformed using the model to the perceptually uniform space, where they are expressed as just-noticeable difference units (JNDs). In order to compute the perceived difference, corresponding bands are first subtracted and per-band difference is calculated. Later, differences from all bands are combined to one map that illustrates the perceived differences. The metric was validated by the authors using scenes with different number of cues, where distortions were introduced as a postprocessing step using a warping method [70].
Another possible application is disparity compression. Since the model can transfer disparity maps into JND space, it is easy to decide which disparities are invisible to the human observer. Removing such information allows for good compression, preserving at the same time the high quality of images. As the response of the HVS can be predicted, it is also possible to enforce the same response on another person or different equipment, as those factors can influence the disparity sensitivity. Therefore, it is possible to display the same content on two different devices optimizing the disparity for both of them in such a way that the depth impression will be similar regardless of the device or the observer. The presented model allows also to adjust the disparity range to the viewing conditions. The usual scaling of disparities, such as the one presented in Reference [66], is performed without taking into account how the HVS perceives disparity. Using the presented model, the disparity can be scaled in the perceptual space and the nonlinear behavior of the HVS will be implicitly captured. Such a method will allow for bigger manipulations of disparities to which the HVS is not sensitive, whereas those places that are crucial for the HVS will be better preserved.
Reference [69] also showed backward-compatible stereo as a novel application of the proposed model. It allows for minimizing disparity in a way that the stereo content seen without glasses does not reveal any significant artifacts; however, once special equipment is used, the observer can experience a stereo effect. As an example application, one can consider the problem of printing a stereo image using anaglyph (red/green or red/cyan glasses) techniques. In such a situation, the stereo impression can be enjoyed only when a viewer wears anaglyph glasses, but when such equipment is not available, standard stereo images can be easily spoiled by color artifacts. In contrast, when the backward-compatible technique is used, the color artifacts can be minimized. The technique can also be useful for other 3D equipment. For example, when the content must be seen through shutter glasses, a person who does not have them will perceive blurred pictures, that is, an average of the left and right eye view.
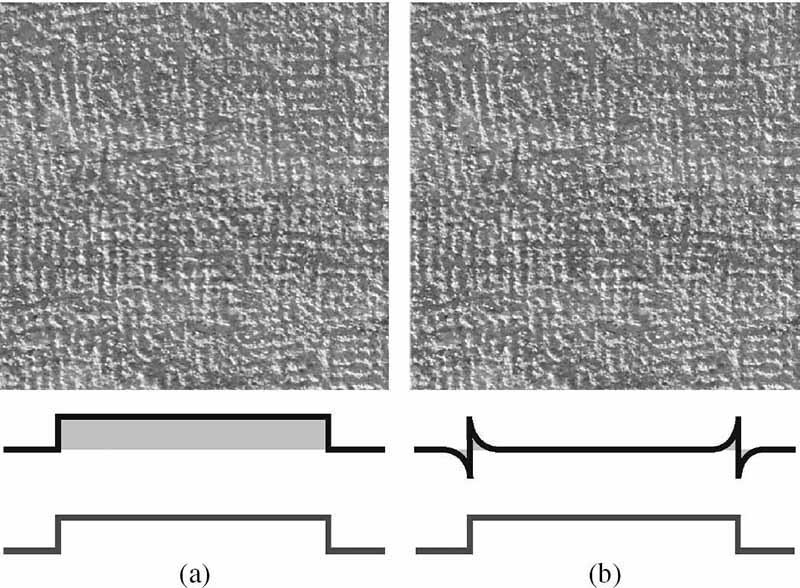
FIGURE 15.19
The Cornsweet illusion shown in anaglyph colors. A circle with (a) depth due to disparity and (b) apparent depth due to Cornsweet disparity profiles. The plots show the disparity profiles and their perceived shapes. The solid area depicts the total disparity, which is significantly smaller when using Cornsweet profiles.
The backward-compatible stereo technique exploits the Cornsweet illusion, which was shown (Section 15.2) to be able to enhance the contrast of luminance patterns. It turns out that the illusion holds for quite different signals, such as perceived line lengths or texture pattern density [71]. Reference [72] found that a depth Cornsweet profile adds to the perceived depth difference between real textured surfaces. In Reference [73], this effect was confirmed for random-dot stereograms. The authors observed that the typically induced depth difference over the whole surfaces amounted up to 40% of the depth difference at the discontinuity, which was roughly twice larger than in experiments conducted in Reference [72] for real surfaces. It was concluded that a gradual depth decay in the Cornsweet profile remains mostly invisible and the object dislocation at the discontinuity is propagated by the HVS over both surfaces [73]. This effect is illustrated in Figure 15.19.
In order to obtain a stereo image that does not exhibit disturbing artifacts while watched without special equipment, the backward-compatible technique first compresses (that is, flattens) the image disparity. At the same time, the disparity metric is employed to make sure that a specified minimum of perceived disparity remains. In this process, the Craik O’Brien-Cornsweet illusion [72], [73] is created on disparity discontinuities by removing the low-frequency component. Since the HVS is less sensitive to low-frequency disparity corrugations, the obtained Cornsweet profiles are not visible. Instead, apparent depth is created by propagating the disparity discontinuities introduced by the profiles over surfaces [73] (Figure 15.20).
One additional advantage of exploiting the Cornsweet illusion comes from the fact that a cascade of the local Cornsweet profiles still conveys a consistent impression of discrete depth changes, while in the traditional approach disparity accumulation is required for proper stereoscopic effect. Thus, there is no need of accumulating global disparities, which further improves the backward compatibility.

FIGURE 15.20 (See color insert.)
Backward-compatible anaglyph stereo (c) offers good depth-quality reproduction with similar appearance to the standard stereo image. The small amount of disparity leads to relatively high-quality images when stereo glasses are not used. To achieve equivalent depth-quality reproduction in the traditional approach significantly more disparity is needed (b), in which case the appearance of anaglyph stereo image is significantly degraded once seen without special equipment.
Note, that the Cornsweet illusion can be also used for enhancement of 3D impression, similarly as it was done for luminance by introducing the unsharp masking profiles described in Section 15.2. Examples of such enhancement can be seen in Figure 15.21.
Because of the huge success of 3D equipment, the study of stereo perception plays an increasingly important role and is likely to still occupy researchers in the future. Especially, the nonlinear relationship between physical disparity and perceived depth is an interesting observation. It is important for a deeper understanding, but also crucial when creating stereo content. It has been even shown that the perceived depth can be augmented by perceptual means. Currently, experts are only scratching the surface of this topic and exciting avenues for future research remain.
15.7 Conclusion
This chapter demonstrated how perceptual effects can be employed to exceed physical limitations of display devices. By capitalizing on various aspects of the human visual system’s insensibility, display qualities, at least perceptually, have been significantly enhanced in a stable and persistent way. Similar enhancement could often be achieved only by improving physical parameters of displays, which might be impossible without fundamental design changes in the existing display technology and clearly may lead to overall higher display costs.
The presented techniques achieve their goals by means of relatively simple image processing operations, which often rely on a skillful gradient introduction into the luminance and disparity domains. The Cornsweet gradient profile inserted across luminance and depth discontinuities (edges in the image) enhances apparent perceived contrast and disparity. The halo effect surrounding bright image regions enhances perceived image brightness. Interleaving, in the temporal domain, high-quality sharpened and low-quality blurred frames on high-refresh rate displays, reduces perceptual hold-type blur and improves apparent motion smoothness. Similar in spirit, the principles of temporal signal integration in the retina can be used to improve color perception, reduce quantization errors on low bit-depth displays, and enhance apparent resolution.
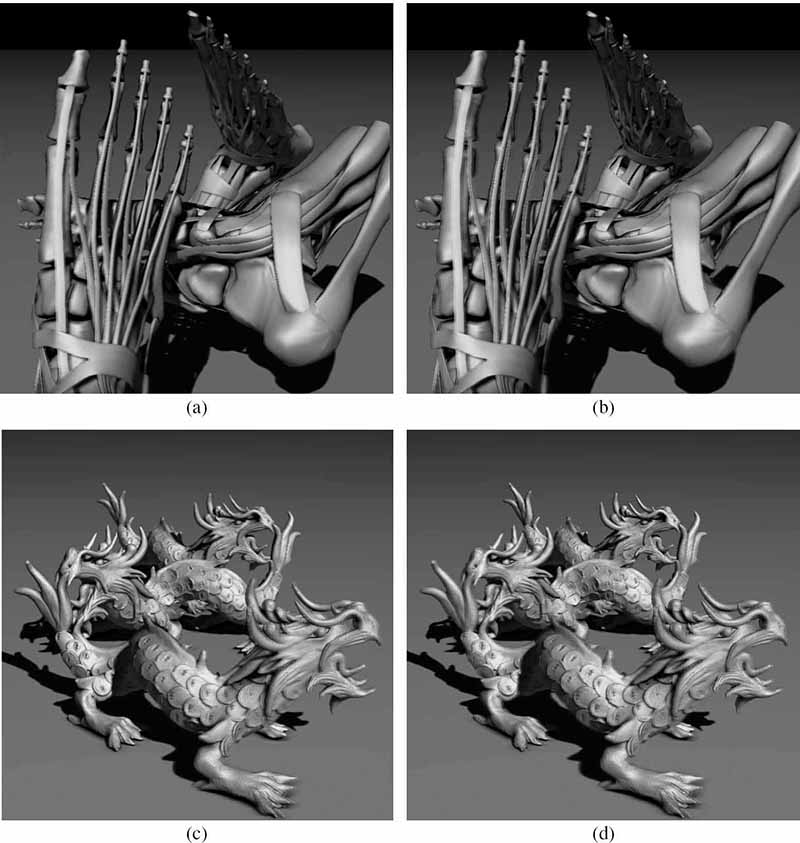
FIGURE 15.21 (See color insert.)
Depth enhancement using the Cornsweet illusion for two different scenes with significant depth range: (a,c) original images and (b,d) enhanced anaglyph images. A better separation between foreground and background objects and a more detailed surface structure depiction can be perceived in enhanced images.
In the research presented here, each quality dimension, such as image contrast, brightness, sharpness, temporal, and spatial resolution, have been handled separately. An interesting question remains: can the possible interactions between those dimensions also be exploited to even further improve apparent display qualities?
Acknowledgment
Figure 15.3 is image courtesy of Grzegorz Krawczyk. Figure 15.4 is image courtesy of Kaleigh Smith and Grzegorz Krawczyk. Figure 15.5 is image courtesy of R. Beau Lotto (www.lottolab.org) and Dale Purves (www.purveslab.net). Figure 15.6 is image courtesy of Kaleigh Smith, and is reprinted from Reference [19] with the permission of ACM. Figure 15.8 is redrawn from Reference [21].
Figures 15.7, 15.9, 15.10, 15.11, and 15.12 are reprinted from Reference [22] and Figures 15.13 and 15.15 are reprinted from Reference [35], all with the permission of the Eurographics Association.
References
[1]. Z. Wang and A.C. Bovik, Modern Image Quality Assessment. San Rafael, CA, USA: Morgan & Claypool Publishers, 2006.
[2]. R. Janssen, Computational Image Quality. Bellingham, WA, USA: SPIE Press, 2001.
[3]. A.J. Calabria and M.D. Fairchild, “Perceived image contrast and observer preference: I. The effects of lightness, chroma, and sharpness manipulations on contrast perception,” The Journal of Imaging Science and Technology, vol. 47, no. 6, pp. 479–493, 2003.
[4]. A. Yoshida, R. Mantiuk, K. Myszkowski, and H.P. Seidel, “Analysis of reproducing real-world appearance on displays of varying dynamic range,” Computer Graphics Forum, vol. 25, no. 3, pp. 415–426, March 2006.
[5]. F. Ratliff, “Contour and contrast,” Proceedings of the American Philosophical Society, vol. 115, no. 2, pp. 150–163, April 1971.
[6]. P.G. Barten, Contrast Sensitivity of the Human Eye and Its Effects on Image Quality. Bellingham, WA, USA: SPIE Press, 1999.
[7]. F. Kingdom and B. Moulden, “Border effects on brightness: A review of findings, models and issues,” Spatial Vision, vol. 3, no. 4, pp. 225–262, January 1988.
[8]. D. Burr, “Implications of the Craik-O’Brien illusion for brightness perception,” Vision Resarch, vol. 27, no. 11, pp. 1903–1913, May 1987.
[9]. D. Purves, A. Shimpi, and R. Lotto, “An empirical explanation of the Cornsweet effect,” The Journal of Neuroscience, vol. 19, no. 19, pp. 8542–8551, October 1999.
[10]. M. Livingstone, Vision and Art: The Biology of Seeing. New York, USA: Harry N. Abrams, 2002.
[11]. W. K. Pratt, Digital Image Processing. New York, USA: John Wiley & Sons, Inc., 2nd edition, 1991.
[12]. W. Lin, Y. Gai, and A. Kassim, “Perceptual impact of edge sharpness in images,” IEE Proceedings Vision, Image and Signal Processing, vol. 152, no. 2, pp. 215–223, April 2006.
[13]. K. Smith, Contours and Contrast. PhD thesis, MPI Informatik, Saarbruecken, Germany, 2008.
[14]. G. Krawczyk, K. Myszkowski, and H.P. Seidel, “Contrast restoration by adaptive counter-shading,” Computer Graphics Forum, vol. 26, no. 3, pp. 581–590, September 2007.
[15]. E. Fedorovskaya, H. deRidder, and F. Blommaert, “Chroma variations and perceived quality of color images of natural scenes,” Color Research and Application, vol. 22, no. 2, pp. 96–110, April 1997.
[16]. K. Smith, G. Krawczyk, K. Myszkowski, and H.P. Seidel, “Beyond tone mapping: Enhanced depiction of tone mapped HDR images,” Computer Graphics Forum, vol. 25, no. 3, pp. 427–438, September 2006.
[17]. K. Smith, P.E. Landes, J. Thollot, and K. Myszkowski, “Apparent greyscale: A simple and fast conversion to perceptually accurate images and video,” Computer Graphics Forum, vol. 27, no. 2, pp. 193–200, April 2008.
[18]. T. Luft, C. Colditz, and O. Deussen, “Image enhancement by unsharp masking the depth buffer,” ACM Transactions on Graphics, vol. 25, no. 3, pp. 1206–1213, July 2006.
[19]. T. Ritschel, K. Smith, M. Ihrke, T. Grosch, K. Myszkowski, and H.P. Seidel, “3D unsharp masking for scene coherent enhancement,” ACM Transactions on Graphics, vol. 27, no. 3, pp. 90:1–8, August 2008.
[20]. D. Zavagno, “Some new luminance-gradient effects,” Perception, vol. 28, no. 7, pp. 835–838, May 1999.
[21]. D. Zavagno and G. Caputo, “The glare effect and the perception of luminosity,” Perception, vol. 30, no. 2, pp. 209–222, September 2001.
[22]. T. Ritschel, M. Ihrke, J.R. Frisvad, J. Coppens, K. Myszkowski, and H.P. Seidel, “Temporal glare: Real-time dynamic simulation of the scattering in the human eye,” Computer Graphics Forum, vol. 28, no. 2, pp. 183–192, March 2009.
[23]. G. Simpson, “Ocular haloes and coronas,” British Journal of Ophthalmology, vol. 37, no. 8, pp. 450–486, August 1953.
[24]. G. Spencer, P. Shirley, K. Zimmerman, and D.P. Greenberg, “Physically-based glare effects for digital images,” in Proceedings of the 22nd Annual Conference on Computer Graphics and Interactive Techniques, Los Angeles, CA, USA, August 1995, pp. 325–334.
[25]. G. Westheimer, “The eye as an optical instrument,” in Handbook of Perception and Human Performance: 1. Sensory Processes and Perception, K. Boff, L. Kaufman, and J. Thomas (eds.), New York, USA: Wiley, 1986, pp. 4.1–20.
[26]. R. Deeley, N. Drasdo, and W. Charman, “A simple parametric model of the human ocular modulation transfer function,” Ophthalmic and Physiological Optics, vol. 11, no. 1, pp. 91–93, January 1991.
[27]. M. Kawase, “Practical implementation of high dynamic range rendering,” in Proceedings of the Game Developers Conference, 2005.
[28]. A. Yoshida, M. Ihrke, R. Mantiuk, and H.-P. Seidel, “Brightness of the glare illusion,” in Proceedings of the ACM Symposium on Applied Perception in Graphics and Visualization, Los Angeles, CA, USA, August 2008, pp. 83–90.
[29]. P. Rokita, “A model for rendering high intensity lights,” Computers & Graphics, vol. 17, no. 4, pp. 431–437, July 1993.
[30]. M. Kakimoto, K. Matsuoka, T. Nishita, T. Naemura, and H. Harashima, “Glare generation based on wave optics,” Computer Graphics Forum, vol. 24, no. 2, pp. 185–193, June 2005.
[31]. T.J. van den Berg, M.P. Hagenouw, and J.E. Coppens, “The ciliary corona: Physical model and simulation of the fine needles radiating from point light sources,” Investigative Ophthalmology and Visual Science, vol. 46, no. 7, pp. 2627–2632, July 2005.
[32]. J. Goodman, Introduction to Fourier Optics. Englewood, CO, USA: Roberts & Co, 2005.
[33]. M.B. Hullin, E. Eisemann, H.P. Seidel, and S. Lee, “Physically-based real-time lens flare rendering,” ACM Transactions on Graphics, vol. 30, no. 4, pp. 108:1–9, August 2011.
[34]. A. Gorea and C.W. Tyler, “New look at Bloch’s law for contrast,” Journal of the Optical Society of America A, vol. 3, no. 1, pp. 52–61, January 1986.
[35]. P. Didyk, E. Eisemann, T. Ritschel, K. Myszkowski, and H.P. Seidel, “Perceptually-motivated real-time temporal upsampling of 3D content for high-refresh-rate displays,” Computer Graphics Forum, vol. 29, no. 2, pp. 713–722, May 2010.
[36]. W.R. Mark, L. McMillan, and G. Bishop, “Post-rendering 3D warping,” in Proceedings of the Symposium on Interactive 3D Graphics, Providence, RI, USA, April 1997, pp. 7–16.
[37]. B. Walter, G. Drettakis, and S. Parker, “Interactive rendering using the render cache,” in Proceedings of the 10th Eurographics Workshop on Rendering, Granada, Spain, June 1999, vol. 10, pp. 235–246.
[38]. D.F. Nehab, P.V. Sander, J. Lawrence, N. Tatarchuk, and J. Isidoro, “Accelerating real-time shading with reverse reprojection caching,” in Proceedings of the 22nd ACM Symposium on Graphics Hardware, San Diego, CA, USA, 2007, pp. 25–35.
[39]. P. Sitthi-Amorn, J. Lawrence, L. Yang, P.V. Sander, D. Nehab, and J. Xi, “Automated reprojection-based pixel shader optimization,” ACM Transactions on Graphics, vol. 27, no. 5, December 2008.
[40]. R. Herzog, E. Eisemann, K. Myszkowski, and H.P. Seidel, “Spatio-temporal upsampling on the GPU,” in Proceedings of ACM Symposium on Interactive 3D Graphics and Games, Bethesda, MD, USA, February 2010, pp. 91–98.
[41]. D. Pajak, R. Herzog, E. Eisemann, K. Myszkowski, and H.P. Seidel, “Scalable remote rendering with depth and motion-flow augmented streaming,” Computer Graphics Forum, vol. 30, no. 2, pp. 415–424, April 2011.
[42]. D. Scherzer, L. Yang, O. Mattausch, D. Nehab, P.V. Sander, M. Wimmer, and E. Eisemann, “A survey on temporal coherence methods in real-time rendering,” in In State of the Art Reports Eurographics, Llandudno, UK, May 2010, pp. 1017–4656.
[43]. G. Wolberg, “Image morphing: A survey,” The Visual Computer, vol. 14, no. 8, pp. 360–372, December 1998.
[44]. F. Liu, M. Gleicher, H. Jin, and A. Agarwala, “Content-preserving warps for 3D video stabilization,” ACM Transaction on Graphics, vol. 28, no. 3, pp. 44:1–9, July 2009.
[45]. D. Mahajan, F.C. Huang, W. Matusik, R. Ramamoorthi, and P. Belhumeur, “Moving gradients: A path-based method for plausible image interpolation,” ACM Transaction on Graphics, vol. 28, no. 3, pp. 42:1–11, July 2009.
[46]. T. Stich, C. Linz, C. Wallraven, D. Cunningham, and M. Magnor, “Perception-motivated interpolation of image sequences,” ACM Transactions on Applied Perception, vol. 8, no. 2, pp. 11:1–25, January 2011.
[47]. X.F. Feng, “LCD motion blur analysis, perception, and reduction using synchronized back-light flashing,” in Proceedings of SPIE, vol. 6057, pp. M1–14, February 2006.
[48]. H. Pan, X.F. Feng, and S. Daly, “LCD motion blur modeling and analysis,” in Proceedings of the IEEE International Conference on Image Processing, Genoa, Italy, September 2005, pp. 21–24.
[49]. H. Chen, S.S. Kim, S.H. Lee, O.J. Kwon, and J.H. Sung, “Nonlinearity compensated smooth frame insertion for motion-blur reduction in LCD,” in Proceedings of the IEEE 7th Workshop on Multimedia Signal Processing, Shanghai, China, November 2005, pp. 1–4.
[50]. T. Kurita, “Moving picture quality improvement for hold-type AM-LCDs,” in Proceedings of the Society for Information Display Conference, San Jose, CA, USA, June 2001, pp. 986–989.
[51]. D. Luebke, B. Watson, J.D. Cohen, M. Reddy, and A. Varshney, Level of Detail for 3D Graphics. New York, USA: Elsevier Science Inc., 2002.
[52]. M.A. Klompenhouwer and L.J. Velthoven, “Motion blur reduction for liquid crystal displays: Motion-compensated inverse filtering,” Proceedings of SPIE, vol. 5308, p. 690, January 2004.
[53]. M. Kalloniatis and C. Luu, “Temporal resolution.” Available online, http://webvision.med.utah.edu/temporal.html.
[54]. O. Artamonov, “X-bit’s guide: Contemporary LCD monitor parameters and characteristics. Page 11.” Available online, http://www.xbitlabs.com/articles/monitors/display/lcd-guide\_11.html.
[55]. P. Didyk, E. Eisemann, T. Ritschel, K. Myszkowski, and H.P. Seidel, “Apparent display resolution enhancement for moving images,” ACM Transactions on Graphics, vol. 29, no. 4, pp. 113:1–8, July 2010.
[56]. P. Mäkelä, J. Rovamo, and D. Whitaker, “Effects of luminance and external temporal noise on flicker sensitivity as a function of stimulus size at various eccentricities,” Vision Research, vol. 34, no. 15, pp. 1981–1991, August 1994.
[57]. K. Templin, P. Didyk, T. Ritschel, E. Eisemann, K. Myszkowski, and H.P. Seidel, “Apparent resolution enhancement for animations,” in Proceedings of the 27th Spring Conference on Computer Graphics, Vinicne, Slovak Republic, April 2011, pp. 85–92.
[58]. S.E. Palmer, Vision Science: Photons to Phenomenology. Cambridge, MA, USA: The MIT Press, 1999.
[59]. J. Cutting and P. Vishton, “Perceiving layout and knowing distances: The integration, relative potency, and contextual use of different information about depth,” in Perception of Space and Motion (Handbook Of Perception and Cognition), W. Epstein and S. Rogers (eds.), San Diego, CA, USA: Academic Press, 1995, pp. 69–117.
[60]. D. Hoffman, A. Girshick, K. Akeley, and M. Banks, “Vergence-accommodation conflicts hinder visual performance and cause visual fatigue,” Journal of Vision, vol. 8, no. 3, pp. 1–30, March 2008.
[61]. A. Brookes and K. Stevens, “The analogy between stereo depth and brightness,” Perception, vol. 18, no. 5, pp. 601–614, 1989.
[62]. P. Lunn and M. Morgan, “The analogy between stereo depth and brightness: A reexamination,” Perception, vol. 24, no. 8, pp. 901–904, 1995.
[63]. M.F. Bradshaw and B.J. Rogers, “Sensitivity to horizontal and vertical corrugations defined by binocular disparity,” Vision Research, vol. 39, no. 18, pp. 3049–3056, September 1999.
[64]. S. Daly, “The visible differences predictor: An algorithm for the assessment of image fidelity,” In Digital Images and Human Vision, A.B. Watson (ed.), Cambridge, MA, USA: MIT Press, 1993, vol. 4, pp. 179–206.
[65]. I.P. Howard and B.J. Rogers, Seeing in Depth: Depth Perception. Toronto, ON, Canada: I. Porteous, vol. 2, 2002.
[66]. M. Lang, A. Hornung, O. Wang, S. Poulakos, A. Smolic, and M. Gross, “Nonlinear disparity mapping for stereoscopic 3D,” ACM Transaction on Graphics, vol. 29, no. 4, pp. 751–760, July 2010.
[67]. C.W. Tyler, “Spatial organization of binocular disparity sensitivity,” Vision Research, vol. 15, no. 5, pp. 583–590, May 1975.
[68]. J. Lubin, “A visual discrimination model for imaging system design and development,” in Vision Models for Target Detection and Recognition, A.R. Menendez and E. Peli (eds.), River Edge, NJ, USA: World Scientific, 1995, pp. 245–283.
[69]. P. Didyk, T. Ritschel, E. Eisemann, K. Myszkowski, and H.P. Seidel, “A perceptual model for disparity,” ACM Transactions on Graphics, vol. 30, no. 4, pp. 96:1–96:10, August 2011.
[70]. P. Didyk, T. Ritschel, E. Eisemann, K. Myszkowski, and H.P. Seidel, “Adaptive image-space stereo view synthesis,” in Proceedings of the Vision, Modeling and Visualization Workshop, Siegen, Germany, November 2010, pp. 299–306.
[71]. D.M. Mackay, “Lateral interaction between neural channels sensitive to texture density?,” Nature, vol. 245, no. 5421, pp. 159–161, September 1973.
[72]. S. Anstis, I. Howard, and B. Rogers, “A Craik-O’Brien-Cornsweet illusion for visual depth,” Vision Research, vol. 18, no. 2, pp. 213–217, 1978.
[73]. B. Rogers and M. Graham, “Anisotropies in the perception of three-dimensional surfaces,” Science, vol. 221, no. 4618, pp. 1409–1411, September 1983.