An important way to understand how a model is performing is by using learning curves. Consider what happens to the training and test errors as we increase the number of samples. Consider a simple linear model. With few training samples, it is very easy for it to fit the parameters, the training error will be small. As the training set grows, it becomes harder to fit, and the average training error will likely grow. On the other hand, the cross validation error will likely decrease, at least at the beginning, as samples are added. With more samples to train on, the model will be better able to acclimatize to new samples. Consider a model with high bias, for example, a simple linear classifier with two parameters. This is just a straight line, so as we start adding training examples, the cross validation error will initially decrease. However, after a certain point, adding training examples will not reduce the error significantly simply because of the limitations of a straight line, it simply cannot fit nonlinear data. If we look at the training error, we see that, like earlier, it initially increases with more training samples, and at a certain point, it will approximately equal the cross validation error. Both the cross validation and train errors will be high in a high-bias example. What this shows is that if we know our learning algorithm has high bias, then just adding more training examples will be unlikely to improve the model significantly.
Now, consider a model with high variance, say with a large number of polynomial terms, and a small value for the regularization parameter. As we add more samples, the training error will increase slowly but remain relatively small. As more training samples are added the error on the cross validation set will decrease. This is an indication of over-fitting. The indicative characteristic of a model with high variance is a large difference between the training error and the test error. What this is showing is that increasing training examples will lower the cross validation error, and therefore, adding training samples is a likely way to improve a model with high variance.
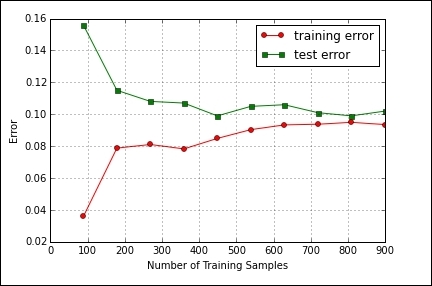
In the following code, we use the learning curve object to plot the test error and the training error as we increase the sample size. This should give you an indication when a particular model is suffering from high bias or high variance. In this case, we are using a logistic regression model. We can see from the output of this code that the model may be suffering from bias, since both the training test errors are relatively high:
from sklearn.pipeline import Pipeline
from sklearn.learning_curve import learning_curve
import matplotlib.pyplot as plt
import numpy as np
from sklearn.preprocessing import StandardScaler
from sklearn.linear_model import LogisticRegression
from sklearn import cross_validation
from sklearn import datasets

X, y = datasets.make_classification(n_samples=2000,n_informative=2, n_redundant=0,random_state=42)
Xtrain, Xtest, ytrain, ytest = cross_validation.train_test_split(X, y, test_size=0.5, random_state=1)
pipe = Pipeline ([('sc' , StandardScaler()),('clf', LogisticRegression( penalty = 'l2'))])
trainSizes, trainScores, testScores = learning_curve(estimator=pipe, X=Xtrain, y= ytrain,train_sizes=np.linspace(0.1,1,10),cv=10, n_jobs=1)
trainMeanErr=1-np.mean(trainScores, axis=1)
testMeanErr=1-np.mean(testScores, axis=1)
plt.plot(trainSizes, trainMeanErr, color='red', marker='o', markersize=5, label = 'training error')
plt.plot(trainSizes, testMeanErr, color='green', marker='s', markersize=5, label = 'test error')
plt.grid()
plt.xlabel('Number of Training Samples')
plt.ylabel('Error')
plt.legend(loc=0)
plt.show()
Here is the output of the preceding code: