CHAPTER 15
What are subject area models?
Need the Big Picture?
No common definitions?
Hero, build a SAM!
The highlighted row in Table 15.1 shows the focus of this chapter – the subject area model (SAM).
Table 15.1 The Subject Area Model is the focus of this chapter
| Relational | Dimensional |
Subject Area Model (SAM) | ‘One-pager’ on how something works | ‘One-pager’ on what is monitored |
Logical Data Model | Detailed business solution on how something works | Detailed business solution on what is monitored |
Physical Data Model | Detailed technical solution on how something works | Detailed technical solution on what is monitored |
A subject area model shows the key concepts in a particular area and how these concepts interact with each other. This chapter defines a subject area, followed by an explanation of the importance of the subject area model and subject area definitions. Then the three types of subject area models are discussed, including the application subject area model, where both relational and dimensional variations exist. Then we provide a summary of the ten-step approach to building a subject area model. We conclude this chapter with a description of the support provided by PowerDesigner for Subject Area Models, and a couple of exercises to reinforce what we’ve told you.
Subject Area Explained
A subject area is a key concept that is both basic and critical to your audience. “Basic” means this term is probably mentioned many times a day in conversations with the people who represent the audience for the model. “Critical” means the business would be very different or non-existent without this concept.
The majority of subject areas are easy to identify and include concepts that are common across industries, such as Consumer, Customer, Employee, and Product. An airline may call a Customer a Passenger, and a hospital may call a Customer a Patient, but they are all people who receive goods or services. Each subject area will be shown in much more detail at the logical and physical phases of design. For example, the Consumer subject area might encompass the logical entities Consumer, Consumer Association, Consumer Demographics, Consumer Type, and so on.
Many subject areas, however, can be more challenging to identify, as they may be subject areas to your audience, but not to others in the same department, company, or industry. For example, Account would most likely be a subject area for a bank and for a manufacturing company. However, the audience for the bank subject area model might also require Checking Account and Savings Account to be on their model, whereas the audience for the manufacturing subject area model might, instead, require General Ledger Account and Accounts Receivable Account to be on the model.
In our example with the business card, a basic and critical concept can be Address, but Mailing Address can also be basic and critical. Should the subject area model for contact management contain Mailing Address as well? To answer this question, we need to know whether Mailing Address is basic and critical to your audience. The key point about subject area modeling is to model at a level where the audience for the model would agree that each subject area is a key concept.
Subject Area Model Explained
A subject area model is a set of symbols and text representing the key concepts and rules binding these key concepts for a specific business or application scope, for a particular audience, that fits neatly on one page. It could be an 8 ½ x 11, 8 ½ x 14, (A4 or A3 in Europe), or similar sized paper, but it cannot be a plotter-sized piece of paper. Limiting the subject area model to one page is important because it forces the modeler and participants to select only key concepts. We can fit 10, 20 or 50 concepts on one page, but not 500 concepts. A good rule of thumb, therefore, is to ask yourself if the audience for this model would include this concept as one of the top 10 or 20 or 50 concepts in their business. This will rule out concepts that are at too low a level of detail; they will appear in the more detailed logical data model. If you’re having trouble limiting the number of concepts, think about whether or not there are other concepts into which the ones you’re discussing could be grouped. These higher concepts are the ones you should be including in the subject area model.
The subject area model includes subject areas, their definitions, and the relationships that show how these subject areas interact with each other. Unlike the logical and physical data models, as we will see, subject area models may contain many-to-many relationships. A sample subject area model appears in Figure 15.1.
Figure 15.1 Healthcare Facility Appointment Subject Area Model

In this diagram, the display preferences in PowerDesigner have been changed to display the Subject Area descriptions.
Business Rules (listed in the order we would typically walk someone through the model):
· Each Person may be a Provider, a Patient, or both a Provider and a Patient. Note that when the subtyping symbol does not have an ‘X’ in its center (as shown in Figure 15.1), it indicates that a member of the supertype can play more than one subtype role. This is called an inclusive (overlapping) subtype. For example, a particular person can be both a provider and a patient.
· Each Provider is a Person.
· Each Patient is a Person.
· Each Provider may offer one or many Appointments.
· Each Patient may make one or many Appointments.
· Each Schedule may be consulted to set up one or many Appointments.
· Each Department may accommodate one or many Appointments.
· Each Appointment must involve one Provider, one Patient, one Department, and one Schedule.
Notice on the model in Figure 15.1, that concepts such as Patient and Provider are likely to be considered subject areas throughout the healthcare industry. There are also slightly more detailed subject areas on this model, such as Schedule and Appointment, which are considered basic and critical, and are therefore subject areas for the particular audience for this subject area model. Yet these more detailed subject areas may not be considered subject areas within a different department, such as accounting and marketing, in this same healthcare company.
During the subject area modeling phase, definitions of the concepts should be given a lot of attention. All too often, we wait until it is too late in the development process to get definitions. Waiting too long usually leads to not writing definitions at all, or doing a rush job by writing quick definition phrases that have little or no usefulness. If the definitions behind the terms on a data model are nonexistent or poor, multiple interpretations of the subject area become a strong possibility. The names of subject areas in SAMs are likely to be operands in logical expressions that define business rules. Imagine a business rule on our model that states that an Employee must have at least one benefits package. If the definition of Employee is lacking, we may wonder, for example, whether this business rule includes job applicants and retired employees.
Remember the three main functions of definitions in Chapter 6? Subject area models are especially relevant for one of these – “Helps initiate, document, and resolve different perspectives of the same concept”. If we can agree on the definitions of our business concepts, we are one step closer to creating a holistic view of the business.
By agreeing on definitions at the concept level, the more detailed logical and physical analysis will go more smoothly and take less time. For example, definitions can address the question, “Does Customer include potential customers or only existing customers?” See the cartoon in Figure 15.2 for an example of what not to do.
Figure 15.2 Clarify key concept definitions early!

We need to do a better job of capturing definitions. In fact, during a recent presentation to over 100 business analysts, I asked the innocent question, “How many of you have an agreed-upon single definition of Customer in your organization?” I was expecting at least a handful of the 100 participants to raise their hands, but no one in the room raised their hand!
When the subject area model is complete, which includes subject area definitions, it is a powerful tool that can provide a number of important business benefits:
· Provides broad understanding. We can capture extremely complex and encompassing business processes, application requirements, and even entire industries on a single piece of paper. This enables people with different backgrounds and roles to understand and communicate with each other on the same concepts, agreeing on or debating issues.
· Defines scope and direction. By visually showing subject areas and their business rules, we can more easily identify a subset of the model to analyze. For example, we can model the entire Logistics department, and then scope out of this a particular logistics application that we would like to build. The broad perspective of a subject area model can help us determine how planned and existing applications will coexist. It can provide direction and guidance on what new functionality the business will need next.
· Offers proactive analysis. By developing a subject area-level understanding of the application, there is a strong chance we will be able to identify important issues or concerns, saving substantial time and money later on. Examples include subject area definition differences and different interpretations of project scope.
· Builds rapport between IT and the business. A majority of organizations have some issues of internal communication between the business and IT departments. Building a subject area model together is a great way to remove or reduce these communication barriers. On one occasion, a key business user and I sketched out a Contact Data Mart subject area model, which built not just business understanding, but also a strong relationship with this key user.
Types of Subject Area Models
There are three types of subject area models. I’ve coined acronyms for them that are easy to remember: the Business Subject Area Model (BSAM), the Application Subject Area Model (ASAM), and the Comparison Subject Area Model (CSAM). The BSAM is a subject area model of a defined portion of the business, the ASAM is a subject area model of a defined portion of a particular application, and the CSAM is a subject area model that shows how something new fits within an existing environment.
Business Subject Area Model (BSAM)
The BSAM is a subject area model of a defined portion of the business (not an application). The scope can be limited to a department or function such as manufacturing or sales. It can be as broad as the entire company or industry. Company data models are often called enterprise data models. In addition to all the concepts within an organization, they can also contain external concepts such as government agencies, competitors, and suppliers. Besides serving as a foundation for an enterprise architecture, a BSAM is also a very good place to start capturing the subject areas and business rules for a new application. All future subject area and logical data models can be based on this initial model.
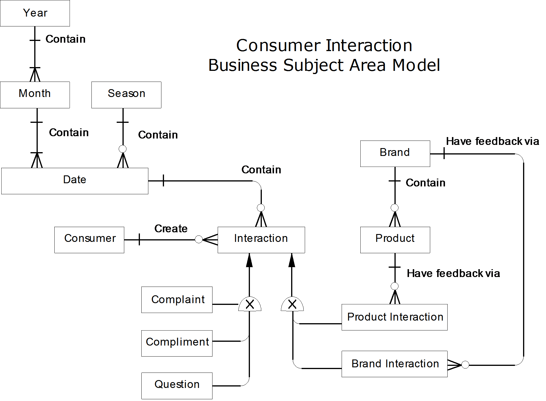
Figure 15.3 contains an example of a BSAM. The purpose of this model was to understand the concepts and high-level business rules within the consumer interaction area, in preparation for building a consumer interaction reporting application. A good first step is to understand how the consumer interaction business works. We could ask questions to learn more about what the business needs, such as:
· What is a Consumer? That is, can a Consumer be someone who has not yet purchased the Product?
· Can one Interaction be placed by more than one Consumer?
· Does an Interaction have to be for a specific Product, or can an interaction be for something more general than a Product, such as a Brand?
· What types of Complaints do you receive?
In Figure 15.3, the name of each relationship is displayed, and the role names (if any) have been hidden. Remember that we can select which relationship names to show on a diagram via the Display Preferences.
Figure 15.3 Consumer Interaction BSAM
Subject area definitions:
Brand | A grouping of products that is recognized by consumers. A brand means something to a consumer in terms of the experience they will have if they purchase a product within this brand. |
Brand Interaction | A contact initiated by one consumer about a specific brand. |
Complaint | Negative feedback that we receive on one of our products or brands. |
Compliment | Positive feedback that we receive on one of our products or brands. |
Consumer | Someone who buys or receives products or services from us with the intent of the products or services being used and not resold; in other words, the final recipient of the product or service. For example, we are a consumer any time we purchase a product from one of our customers. |
Date | A period of time containing 24 hours. |
Interaction | A contact between an employee and a consumer for a specific product or brand. An interaction can take place through a variety of mediums, such as through phone, email, and mail. Interactions fit into one of three categories: complaints, compliments, or questions. Here are examples of some of the interactions: · “I love your product.” (compliment) · “I hate your product.” (complaint) · “I found a strange object in your product.” (complaint) · “Where can I buy your product?” (question) · “I found your product difficult to assemble.” (complaint) |
Month | One of the twelve major subdivisions of the year. |
Product | The goods or services that are offered for sale. |
Product Interaction | A contact initiated by one consumer about a specific product. |
Question | An inquiry that we receive on one of our products or brands. |
Season | A season is one of the major divisions of the year, generally based on yearly periodic changes in weather. |
Year
| A period of time containing 365 days (or 366 days in a leap year). |
Business Rules (listed in the order we would typically walk someone through the model):
· Each Year must contain exactly 12 Months.
· Each Month must belong to one Year.
· Each Month must contain one or more (up to 31) Dates.
· Each Date must belong to one Month.
· Each Season may contain one or more Dates.
· Each Date must belong to one Season.
· Each Brand may contain one or more Products.
· Each Product must belong to one Brand.
· Each Consumer may create one or more Interactions.
· Each Interaction must be created by one Consumer.
· Each Date may contain one or more Interactions.
· Each Interaction must occur on one Date.
· Each Interaction may be a Complaint, Compliment, or Question.
· Each Complaint is an Interaction.
· Each Compliment is an Interaction.
· Each Question is an Interaction.
· Each Interaction may be a Product Interaction or a Brand Interaction.
· Each Product Interaction is an Interaction.
· Each Brand Interaction is an Interaction.
· Each Product may have feedback via one or more Product Interactions.
· Each Product Interaction must provide feedback on one Product.
· Each Brand may have feedback via one or more Brand Interactions.
· Each Brand Interaction must provide feedback on one Brand.
This model revealed a reporting challenge. One of the reporting requirements was to determine how many interactions are reported at a brand level. The model shows that interactions can be entered at a product level, which then roll up to a brand. Or interactions can come in directly at the brand level. The challenge is to answer this question: “How many interactions are there at a brand level?” According to our data model, if we just summarize those product interactions up to a brand level (i.e., follow the relationship from Interaction to Product Interaction to Product to Brand), we are missing those interactions that occur only at the brand level. Therefore, we need to summarize product interactions up to a brand and then add those interactions at just a brand level to get the total number of interactions at a brand level to answer this question.
The BSAM is the most frequently built type of subject area model. Many times when we say we are creating a subject area model, we mean the BSAM. Before embarking on any large development effort, we first need to understand the business. If an organization needs a new claims-processing system, it needs to have a common understanding of claims and related subject areas. The BSAM can be created simply to develop an understanding of a business area, or as the beginning of a large development effort, such as introducing packaged software into your organization.
Application Subject Area Model (ASAM)
The ASAM is a subject area model of a defined portion of a particular application. BSAMs are frequently the first step in large development efforts (first understand the business before you understand the application), so they are usually the starting point for the ASAM. The ASAM is often a subset of the BSAM. For example, after creating the BSAM of the Human Resources department, we can now carve out of it an ASAM for an application that will track employee training.
 In PowerDesigner, we would generate the ASAM CDM from the BSAM CDM.
We mentioned earlier that there are two modeling mindsets: relational and dimensional. Relational and dimensional data models lead to relational- and dimensional-based applications, so we have two types of ASAMs: relational and dimensional. Relational ASAMs focus on how the business works through the eyes of the application, while dimensional ASAMs focus on how the business is monitored through the eyes of the application.
I once built a relational ASAM to capture the classifications concept in the Enterprise Resource Planning (ERP) software package, SAP/R3. In an effort to understand how SAP treats classifications (terminology, rules, and definitions), I created this model from studying screens, help files, and a large number of the underlying 350 database tables within Classifications. Figure 15.4 contains a subset of this model.
In Figure 15.3, we showed just the name of the relationship. In Figure 15.4, we decided to display all of the relationship role names, using an italic font. The assertion statements that PowerDesigner generates from the role names match the business rules listed below. The entity symbols display a property we added ourselves, called Notes and Examples, to hold text that is useful for helping us understand each entity, but is not necessary for describing them.
Business Rules (listed in the order we would typically walk someone through the model):
· Each Class may contain one or many Classes.
· Each Class may be contained in one Class.
· Each Class must be described by many Characteristics.
· Each Characteristic must describe many Classes.
· Each Characteristic may contain one or many Characteristic Values.
· Each Characteristic Value must belong to one Characteristic.
· Each Class must organize many Objects.
· Each Object must be organized by many Classes.
· Each Object must be assigned many Characteristic Values.
· Each Characteristic Value must be assigned to many Objects.
Figure 15.4 Subset of SAP/R3 Classifications
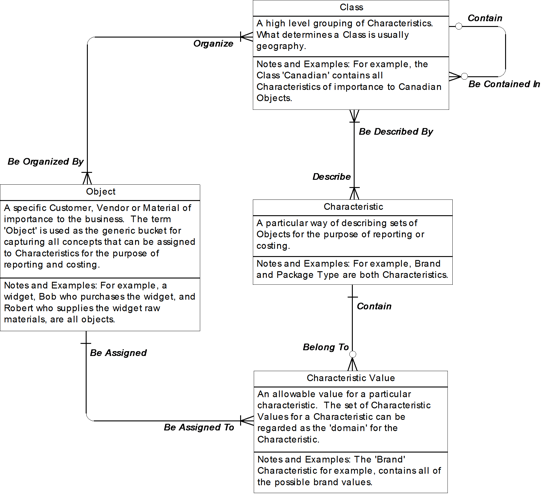
This SAP/R3 ASAM was used for educational purposes, as well as to gauge the effort to customize the application. Notice that on this particular model, showing the definitions directly on the model helps the reader to understand the concepts, as terms such as Object and Class can be ambiguous. This model was first used in a joint IT and business department meeting where the goal was to clearly explain SAP/R3 Classifications in 30 minutes or less. This was not an easy task, as SAP/R3 is a very complicated system, and showing the audience the underlying 350 database tables within the Classifications area would most likely have led to the audience running screaming from the room. Therefore, this model was produced to get the main concepts across to the audience. Somewhere hidden in those 350 database tables are these four key concepts and accompanying business rules. The model was extremely well-received, and I know from the comments and questions from the audience that both the business and IT folks understood it.
We can also build a dimensional ASAM, such as the example in Figure 15.5, which builds on our ice cream example.
Figure 15.5 Dimensional ASAM example

Subject area definitions:
Gross Sales | The total dollar amount charged for all goods or products sold or distributed. Also included in gross sales is sales tax. Returns from melted ice cream are not deducted. |
Ice Cream Flavor | The distinctive taste of one ice cream product over another. Flavors are recognized and selected by consumers. Examples include Chocolate, Vanilla, and Strawberry. |
Ice Cream Theme | A group of ice cream flavors that share at least one common property. For example, the Brownie Ice Cream and Cake Batter Ice Cream flavors are grouped into the Cake Ice Cream Theme. |
Month | One of the twelve major subdivisions of the year. |
State | A subset of the United States; one of the fifty states. |
Year | A period of time containing 365 days (or 366 days in a leap year). |
Navigation paths (listed in the order a user would typically navigate through the model):
“I need to see Gross Sales for each Theme and Year. If there are any surprises, I will need to drill down into the details. That is, drill down from Theme to Flavor, from Year to Month, and add State to my queries.”
Notice that with a dimensional model, the focus is more on navigation than on business rules, as in a relational model.
Comparison Subject Area Model (CSAM)
The CSAM is a subject area model that shows how something new fits within an existing environment. It is used primarily for impact analysis and issue resolution. CSAMs build on two or more ASAMs, in which one or more ASAMs represent an existing application environment and (optionally) one or more ASAMs represent proposed changes to an environment.
The CSAM identifies gaps, touch points, and overlaps. It compares something new with something in place to see whether there are gaps or redundancies. Here are some examples where a CSAM would be useful:
· Proposed data mart within current data warehouse architecture. The CSAM will show how the new data mart requirements fit into what currently exists within the data warehouse.
· Proposed additional functionality to an existing operational or data mart application. The CSAM will highlight the new functionality and show how it fits in with current functionality.
· Replacing an application. The CSAM can show the overlap at a subject area level when you are replacing an existing application with a new application.
The CSAM also helps estimate the development effort. Because we are showing the overlap and gaps that a new application will cause within our environment, we can more easily develop a high-level estimate for the development effort. For example, superimposing a new reporting application over an existing data warehouse environment can help us find areas of the reporting application where the programming effort will be greater than in those areas already existing in the warehouse.
The CSAM requires the most effort to build, but of the three types of subject area models, it can provide the most benefits. It requires the most effort because there is more than one viewpoint to represent on a model. More than one perspective often leads to more than one interpretation of a subject area, or the rules between subject areas. It takes time to identify these differences and resolve, or at least document them. The CSAM provides the most benefits because we are showing impact or issues at a high-level of granularity. What’s more, it is likely that this high-level, cross-application view has not been captured and explained with such clarity previously. Figure 15.6 includes an example of a CSAM.
In the CSAM in Figure 15.6, we are capturing how a proposed new data mart would impact an existing data warehouse. Building on our ice cream example, the current data warehouse for this ice cream store contains those subject areas that are not shaded in gray. That is, the data warehouse currently contains Ice Cream Cone, Ice Cream Container, Ice Cream Cup, Ice Cream Flavor, and Ice Cream Scoop. The dimensional ASAM example from Figure 15.5 is a proposed data mart. All of the concepts on this proposed data mart are in the ice cream store data warehouse with the exception of those two terms shaded in gray: Ice Cream Theme and Order. (Note that the concepts of Month, Year, State, and Gross Sales from Figure 15.5 are derived from detailed orders. Therefore, Order in Figure 15.6, includes these four concepts.) This CSAM is an excellent tool to explain to the data warehouse and data mart stakeholders what the impact (and therefore, the cost and benefit) of creating this new data mart within the existing data warehouse would be.
Figure 15.6 CSAM example – Ice Cream

Subject area definitions:
Ice Cream Cone | An edible container which can hold one or more ice cream scoops. |
Ice Cream Container | A holder of ice cream that is either edible, in the case of an ice cream cone, or recyclable, in the case of an ice cream cup. |
Ice Cream Cup | A recyclable container which can hold one or more ice cream scoops. |
Ice Cream Flavor | The distinctive taste of one ice cream product over another. Flavors are recognized and selected by consumers. Examples include Chocolate, Vanilla, and Strawberry. |
Ice Cream Scoop | A single ball-shaped unit of ice cream formed in a company-standard size ice cream scoop and packaged in one ice cream container. |
Ice Cream Theme | A collection of ice cream flavors that have been grouped together because they share at least one common property. For example, the Brownie Ice Cream and Cake Batter Ice Cream flavors are grouped into the Cake Ice Cream Theme. |
Order | Also known as an ice cream sale, an order is when a consumer purchases one or more of our products in a single visit to our ice cream store. |
Business Rules (listed in the order we would typically walk someone through the model):
· Each Ice Cream Container may hold one or many Ice Cream Scoops.
· Each Ice Cream Scoop must be held in one Ice Cream Container.
· Each Ice Cream Container is either an Ice Cream Cone or an Ice Cream Cup.
· Each Ice Cream Cone is an Ice Cream Container.
· Each Ice Cream Cup is an Ice Cream Container.
· Each Ice Cream Flavor may be the selection choice for one or many Ice Cream Scoops.
· Each Ice Cream Scoop must contain one Ice Cream Flavor.
· Each Ice Cream Theme may group one or many Ice Cream Flavors.
· Each Ice Cream Flavor must be grouped by one Ice Cream Theme.
· Each Order must be placed for one or many Ice Cream Containers.
· Each Ice Cream Container must appear on one or many Orders.
How to Build a Subject Area Model
Following is a brief summary of the ten steps to complete a SAM (for more on this approach, please refer to Chapter 4 in Data Modeling for the Business: A Handbook for Aligning the Business with IT using High-Level Data Models, ISBN 9780977140077, where the SAM is referred to as a High-Level Data Model, or HDM):
1. Identify model purpose. Before starting any data modeling effort, first identify why the model needs to be built. The underlying reason for building a data model is communication. We build data models so we can ensure that we and others have a precise understanding of terminology and business rules. In this step, we identify our communication needs. What are we communicating? Who are we communicating it to? Always “begin with the end in mind”, as Stephen Covey would say. The most popular reason for building a SAM is to gain understanding of an existing area of the business. We can model a department such as Sales or Accounting, a line of business such as Home Mortgages, or even the entire organization. The SAM is also a very good place to start capturing the concepts and business rules for a new application, so that terminology, rules, and definitions can be agreed upon prior to detailed project analysis.
2. Identify model stakeholders. Document the names and departments of those who will be involved in building the SAM, as well as those who will use it after its completion. Roles include architects, analysts, modelers, business users, and managers. Both business and IT roles are required for success. I remember one project I worked on where only IT people showed up to build the SAM. As enthusiastic as we all were to build the model and get support for the project, it was a losing effort because without the business, the model lost credibility and the project, therefore, lost financial support.
3. Inventory available resources. Leverage the results from Step 2, as well as identify any documentation that could provide useful content to the SAM. The two types of resources are people and documentation. People include both business and IT resources. Business people may be management and/or knowledge users. IT resources can span the entire IT spectrum, from analysts through developers, from program sponsors to team leaders. From the people side, this step can be as simple as assigning actual people to the builder roles in Step 2. For example, if we are building a SAM of the manufacturing section of our business, Bob, the business analyst who spent 20 years of his career working in the plant, would be an excellent resource to assign as a builder. Documentation includes systems documentation and requirements documents. Systems documentation can take the form of documentation for a packaged piece of software, or documentation written to support a legacy application. Requirements documents span business, functional, and technical requirements, and can be an essential input to building the SAM.
4. Determine type of model. Decide whether the BSAM, ASAM, or CSAM is the most appropriate. Base your selection on the purpose of the model and the available resources.
5. Select approach. There are three approaches for building a subject area model: top-down, bottom-up, and hybrid. Even though these approaches sound completely different from each other, they really have quite a lot in common. In fact, the major difference between the approaches lies in the initial information-gathering step. The top-down approach begins with a purely business needs perspective. We learn how the business works and what the business needs from the business people themselves, either through direct meetings with them, or indirectly through requirements documents and reports. The business people are allowed to dream - they should reach for the sky. All requirements are considered possible and doable. The bottom-up approach, on the other hand, temporarily ignores what the business needs and instead focuses on the existing systems environment. We build an initial subject area model by studying the systems that the business is using today. It may include operational systems that run the day-to-day business, or reporting systems that allow the business to view how well the organization is doing. Once the existing systems are understood at a high level, new concepts may be introduced or existing concepts can be modified to meet the business needs. The hybrid approach completes the initial information gathering step by usually starting with some top-down analysis, and then some bottom-up analysis, and then some top-down analysis, etc., until the information gathering is complete. First, there is some initial top-down work to understand project scope and high level business needs. Then we work bottom-up to understand the existing systems. The whole process is a constant loop of reconciling what the business needs with what information is available.
6. Complete audience-view SAM. Produce a SAM using the terminology and rules that are clear to those who will be using the model. This is the first high-level model we build. Our purpose is to capture the viewpoint of the model’s audience without complicating information capture by including how their perspective fits with that of other departments, or with the organization as a whole. Our next step will reconcile the deliverable from this step with enterprise terminology. Here our purpose is just to capture their view of the world. The initial model can be created by standing at a white board or flipchart with the users. Sometimes 30 minutes at a white board with a business user can reveal more about what they want than spending hours reading requirements documents.
7. Incorporate enterprise terminology. Now that the model is well-understood by the audience, ensure the terminology and rules are consistent with the organization view. To build the enterprise perspective, modify the audience model to be consistent with enterprise terminology and rules. Ideally, this enterprise perspective is captured within an enterprise data model. You might have to schedule meetings between the people whose view is captured in the audience-specific model and those who share the enterprise perspective, to resolve any terminology or definition issues.
8. Signoff. Obtain approval from the stakeholders that the model is correct and complete. After the initial information gathering, make sure the model is reviewed for data modeling best practices, as well as for meeting the requirements. The signoff process on a SAM does not require the same formality as signoff on the physical design, but it should still be taken seriously. Usually, email verification that the model looks good will suffice. Validating whether the model has met data modeling best practices is often done by applying the Data Model Scorecard®, which will be discussed in Chapter 22.
9. Market. Similar to introducing a new product, advertise the data model so that all those who can benefit from it know about it. If the model has a relatively small scope, it is possible that the users who helped you build and validate the model are also the only ones who need to know about it, so marketing requires little effort. However, most SAMs span broad areas, so it is essential to let the appropriate business and IT resources know it is available to them. Techniques include ‘Lunch-and-Learns’, advertisements on corporate intranets, and presenting the model at periodic management meetings.
10. Maintain. SAMs require little maintenance, but they are not maintenance-free. Make sure the model is kept up-to-date. The SAM will not change often, but it will change, and we need to have formal processes for updating this model to keep it up to date. What works well is to have two additional steps in your software methodology:
1. Borrowing from a SAM, and
2. Contributing back to the SAM.
After the SAM is complete, and before starting a logical data model, for example, the SAM should be used as a starting point for further modeling. The second step in the methodology requires taking all of the lessons learned during the project and making sure all new concepts are incorporated back into the SAM. In PowerDesigner, create and maintain linkages from your SAM to other CDMs, LDMs, and perhaps PDMs.
Subject Area Models in PowerDesigner
If you have worked through the earlier chapters, you’ve already tried all the PowerDesigner techniques you need to create a SAM:
Chapter 10 | General ‘how-to’ knowledge |
Chapter 11 | Creating Entities |
Chapter 13 | Creating Relationships |
We do not suggest that you include attributes in a SAM, hence the above list doesn’t include data elements or keys. Always use a PowerDesigner CDM to create a SAM.
CDM Settings
 Before you add content to your model, we suggest that you set the options listed in Table 15.2. Remember to click on <Set As Default> within the model options and display preferences.
Table 15.2 CDM settings
Category | Settings |
Model Options – | Entity/Relationship notation. Allow duplicate codes for relationships. Enable links to requirements (if you intend to create a Requirements model). |
Model Options – | Enable Glossary for auto completion and compliance checking (if you use a Glossary). |
Display Preferences – General Settings | Enable the following: Show Bridges at Intersections Auto Link Routing Snap to Grid Enable Word Wrapping If you have a preference for the color of lines and symbol fill, or for the use of symbol shadows, set them here. |
Display Preferences – Entity | Hide all properties, except perhaps the description (you’ll need to add this property). |
Display Preferences – Relationship | Hide all properties, except the name or the source role name, depending on your approach to naming relationships (see below). Set the line style to ‘rounded right-angles’. |
Display Preferences – Inheritance | Hide all properties. |
Set the line style to ‘rounded right-angles’. | |
Display Preferences – Traceability Link | Set the line style to ‘rounded right-angles’. |