A number of models attempt to map out the relationship among companies, their products, and their target audience. In 1991, Geoffrey Moore suggested one influential model in his book, Crossing the Chasm.
This model helps company and product leadership think about the target audience for their upcoming product by segmenting people according to their attitudes toward a new technology - an important consideration, since technology plays a major role in many products.

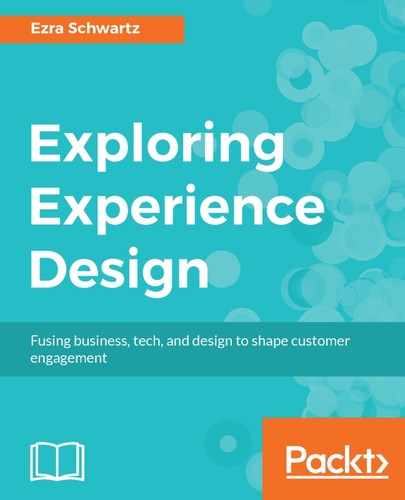
The preceding bell-curve diagram depicts the technology-adoption life cycle of a product. The center portion of the curve represents the largest number of potential customers, and their numbers decrease as the curve slopes down left and right. The curve is divided into five portions, each representing one of the following clusters of people:
- Innovators: On the far left of the curve are people who are not afraid of taking risks with products that at the 'bleeding edge', featuring new and sometimes untested technologies. The products may be so new that they are classified as Alpha or Beta releases, terms that refer to early versions of products still undergoing considerable development changes.
Innovators often also create new technologies themselves, and generally understand what they are getting themselves into with such products. "Techies", as the model refers to people in this segment, represent a small portion of the overall target audience. - Early adopters: To the right of the innovators is a larger segment of people who love technology, have an interest in being early trend-setters, or enjoy the exclusivity and prestige that is associated with owning products. Back in the 1990's, for example, products in the category included large-screen plasma televisions and hybrid cars - items are are common place today, or in the case of plasma TV, have been nearly pushed out of the existence due to LCD displays. Early versions, however, tend to be expensive because they are produced in smaller quantities at higher costs per unit, and their distribution is limited. Visionaries, as the model refers to people in this segment, are influencers, since their product choices tend to be followed.
- Early majority and late majority: Occupying the center of the curve are two groups that represent the largest portion of total audience for the product-- people who are likely to purchase once it's value has been proven by the previous segments.
As the buzz around the product reverberates through word-fo-mouth and social network, its position as a desirable status symbol firms up, as does its value and cost preposition. It gains critical mass as the early majority of customers, the 'pragmatists', buy it in droves. The curve peeks, and as time passes, the product matures, evolves and becomes a 'safe bet' which appeals to the second big wave of customers - the 'conservatives', as the late majority is referred to in the model. The curve continues to slope down: as the product becomes more popular, it becomes less exclusive and eventually early adopters move on to the new-new thing, and the cycle begins for a new product. - Laggards: The segment on the far right of the curve represents people who are diametrically opposite to the innovators and early adopters segments. They are generally suspicious of new technology and refuse to consider it unless they must. Instead, they stick with the products they own until they can no longer be repaired or replaced by a similar product. Often, the source of their resistance to change is not related to financial means and ability to afford the new technology, but because they see no value in doing so. They are skeptics, as the model refers to the group, whose size in the model equals the combined two segments on the far left of the curve.
A major unknown question for a company often centers around the adoption rate of its new product--will it be liked by early adopters, and if so, how long will the transition to the early majority segment take? The transition gap between the segments is the chasm that must be crossed for the product to become a commercial success. If the transition does not happen, or it is too slow, the product and possibly the company might fail.
Over the past three decades companies tried various approaches to gaining success in an attempt to capitalize on the market's appetite for the latest technological trends. In recent years, however, this appetite has flattened out as customers became more interested in ease of use. Experience design has emerged as a significant contributor to helping companies bridge the adoption gap.
Companies are pressured to deliver new versions of their product every year or two, because their revenue is realized by selling more items each year. Customers, however, reach a point of saturation, satisfied with the version of the product they already have, they don't feel that a few new features justify the effort and cost of replacement.
Think about going to the best restaurant in the world. You are served the best food you have ever tasted. It is an "eat as much as you can" buffet, and you eat until you can no longer put anything in your mouth. Once you are full, any additional food, regardless of how fantastically great it is, will not be enjoyable. In fact, overeating will hurt your overall dining experience.
When loyal early adopters and early majority customers reach a saturation point and are disinterested in upgrading their existing product, they are probably ready for a new, different, and refreshing alternative. Increasingly, new options are not similar products with more features. Instead, they make an existing product experience obsolete.
For example, the experience of using software products inevitably involved purchase and update steps, which had a couple of major drawback for customers and software maker:
- When a new version of the software was released, the customer had to pay for an upgrade, and sometimes, pay the full cost of the new version if their old version no longer qualified for a discount.
- Installation of software was often complicated by lost licenses, hardware incompatibilities, and other technical glitches. Software updates involved reinstallation, which was too complicated for many users, and even when web-based automatic updates became common, many customers did not keep up with the latest patches and updates.
- The customer had to pay the full price of the software even when they needed it only for a single or infrequent use.
Cloud-based software-as-a-service (SaaS) has emerged as a solution that eliminated those three issues. In 2005, the start-up, Upstartle (later acquired by Google), created a browser-based word processor called Writely, which has since been renamed Google Docs.
Google Docs was one of the pioneering products to compete with a powerful market leader (Microsoft Word, in this case) and essentially changed the entire way most software are experienced today. It has eliminated the cost of software--it was free, no installation was involved, because it was hosted on the cloud and accessed through most web browsers, which also meant that new features and updates appeared immediately upon release.
Within a decade, Microsoft had to switch its entire Office suite to the cloud, as the old model of software ownership faded away. The trend towards a subscription-based model has expanded from software to the products, as companies are experimenting with applying the model to physical products, such as cars and large appliances. The customer gains all the benefits associated with owning the item, at a fraction of a cost, while the company gets to extend the number of subscribers and offer a scaling model of features. Such a model provides a basic set of features and capabilities as a low introductory price, often for free.
The low cost translates to low risk for the customer who is trying out the product, and everyone wins: The most basic access is often offered for free, while more expensive subscription tiers provide more features and functionalities focused on meeting the needs of professionals, teams and enterprises, as illustrated the following screenshot of LucidChart.com, a could-based charting software:

Additionally, this approach addresses a core design principle which stresses the importance of reducing the overload and complexity of the experience.