Appendix C. The R Commander Graphical User Interface
Some people just do not like the command-line interface of R and would prefer to work in a graphical user interface (GUI; a.k.a. point-and-click) environment. If you do not work with R on a regular basis, it can be hard to remember the R commands; or you might find that you make a lot of mistakes when typing, or that it can be painfully slow to make some simple graphs. Using R Commander could make your life a little more pleasant, with the caveat that you will not have access to the full range of R capabilities with the point-and-click interface.
If you want to try R Commander, you first must install it by using the following command:
> install.packages("Rcmdr", dependencies=TRUE)
After you’ve installed it, you won’t need to do it again, but you must load it during each session for which you want to use it. Here’s the command to do that:
> library(Rcmdr)
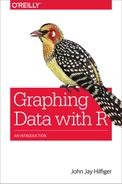
The R Commander window appears in Figure C-1. You will probably find that you can produce routine graphs/tables/analyses more quickly by using R Commander, but some highly customized graphs will not be possible. The console will stay open and you can go back and forth between the two windows if you want to use both the GUI and the command-line interface. Alternatively, you can type a command into the R Script window of R Commander and select it. To select a command, click the beginning of the line, drag across the line to the end, and release the mouse button. The line will now be highlighted. Click the Submit button, and R will execute the command.
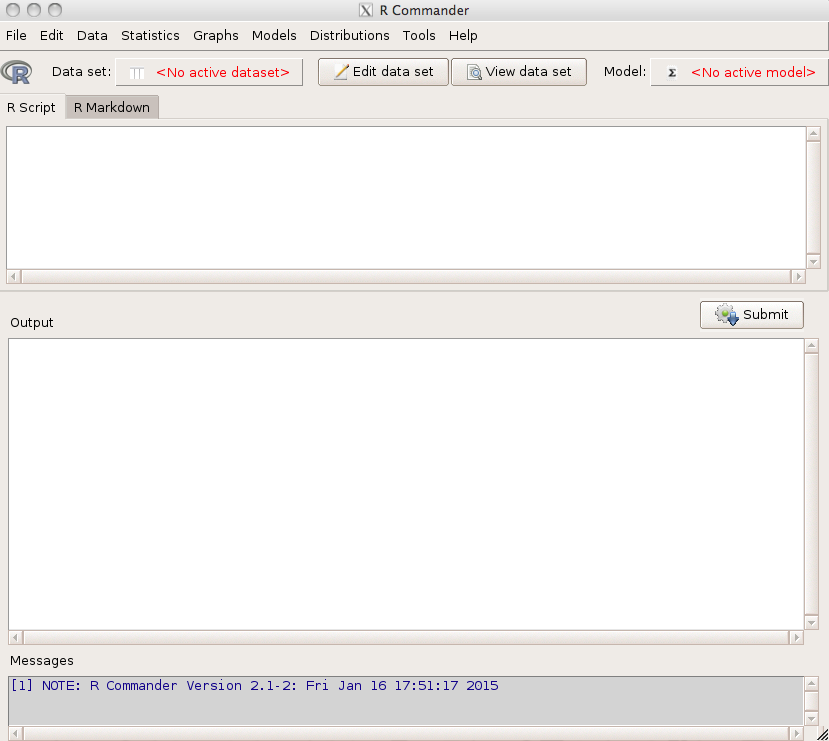
Figure C-1. The R Commander GUI interface for R.
Try working through the strip chart problems in Chapter 3 using R Commander. At the top of the screen, on the menu bar, click Data. On the menu that opens, choose “Data in packages” and “Read dataset from an attached package.” Figure C-2 shows the window that opens, in which you can select the trees data set. Click OK.

Figure C-2. Selecting a dataset in R Commander for analysis with R.
Below the menu bar, you will see that trees is now the active dataset. Continue by selecting “strip chart” from the Graphs window. Compare your result to the first chart in Chapter 3. Next, try to duplicate the second chart, the one that demonstrates jittering. (Hint: after you open the strip chart window, click “options.”) You will not be able to replicate the other charts in that chapter by using only the GUI. If you want to produce the third graph, you can submit a command line to R in the R Script window. The easiest way to do this is to edit the command line produced when you made the previous graph. Just add the pch=20 parameter and edit the xlab argument (see Figure C-3). When you have the command the way you want it, select it and then click Submit.
Figure C-3. Using the R Script window to submit a command line to R.
If you like R Commander, try to replicate some other examples from the book with this GUI. In many cases, it will not be hard to figure out what to do if you know how the graph should look. For more complex graphs, you will need to type a command.
It is possible to extend R Commander (i.e., add more commands). You can do this by using a plug-in. As I write this, 36 plug-ins are available to be installed, just the way you would install other packages. Most of them add many new commands. It is also possible to write your own. For more information, click Help on the menu bar, or see the R Commander web page at http://www.rcommander.com, the author’s web page at http://socserv.mcmaster.ca/jfox/Misc/Rcmdr/, or the complete list of R packages at http://cran.r-project.org/web/packages/available_packages_by_name.html. Scroll down to the entries that begin with “RcmdrPlugin.”
Many of the plug-ins have one or more graphical functions. To see how plug-ins work, install RcmdrPlugin.HH. The package HH contains a number of useful graphic functions. The plug-in makes these functions available from R Commander. First, install the package:
> install.packages("RcmdrPlugin.HH", dependencies=TRUE)
Next, start R Commander:
> library(Rcmdr)
When the R Commander screen opens, on the menu bar, click Graphs. Get a sense of how many options there are without the plug-in. To load the plug-in, click the Tools option on the Menu bar and select “Load Rcmdr plug-ins.” On the menu that follows, select the plug-in name. Now, look at the Graphs option again: you will notice many more choices than before, all in the bottom half of the menu. Some of these add really useful options. For example, the Scatterplot.HH plug-in offers much greater control of output (such as type and size of plot character), several kinds of lines to put on the graph, and even the ability to click a point and have it identified.
Several other plug-ins include nice graphic functions, too. Unlike RcmdrPlug.HH, some of them will add a new menu to the menu bar. Among the ones that add interesting graphs are RcmdrPlugin.KMggplot2, RcmdrPlugin.NMBU, RcmdrPlugin.EZR, and others.