
Publishing to Excel Services
This example provides a walk-through of exporting a SharePoint list to an Excel 2010 spreadsheet, and then publishing that content using Excel Services. This replicates the example offered in the previous section titled “The Excel Services Service Application,” where a manager asks his employees to update a SharePoint list with sales data, and then he exports this to Excel 2010, edits it, and then publishes back to SharePoint 2010 using Excel Services. The home page for the site is then edited to include an Excel Web Access web part that links to the published content.
This example helps to clarify the full process of publishing using Excel Services and then exposing the data using the Excel Web Access web part, so administrators and power users can get a sense for what is and isn’t possible using Excel Services. This is just “scratching the surface,” and administrators and power users should feel free to then experiment with publishing other Excel workbooks using Excel Services and learning what is and isn’t supported in the publishing process.
Prerequisites for this example include the following:
• SharePoint 2010 Enterprise must be installed and an Excel Services service application must be configured and working for the site where the lists live.
• A workstation with Excel 2010 must be available.
Note
Excel 2007 allows users to publish to SharePoint 2010 document libraries using Excel Services, but the steps will differ from this example and overall functionality will be different.
The site that will be used needs to have a custom list that will be described next, as well as a document library that doesn’t need any special configuration settings. The site used in this example is http://abcsp1004/sites/Chapter26.
To walk through this example, follow these steps:
- Create a Product Sales list with using the custom List template that contains the columns and settings described in Table 26.1.
Table 26.1. Product Sales List Columns and Settings

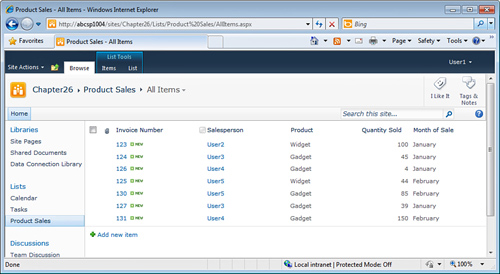
- Add several items to this list so that there will be enough data to create charts from (for example, data for several different salespeople for different products sold in different months). An example of the resulting list is shown in Figure 26.2. This simulates a simplified tracking tool that salespeople use to enter their sales into a list that the manager will then verify, analyze, and publish in Excel Services.
Figure 26.2. Custom list to use for Excel Services test.
- Click the List tab on the Ribbon and select Export to Excel button.
- Click Open when the File Download window opens.
- Click Enable when the Microsoft Excel Security Notice window opens. This enables data connections between the computer and SharePoint 2010, which are required to update the content of the workbook at a later time.
- Excel will open and display the content similar to what is shown in Figure 26.3. Actual values will vary based on what was entered in the SharePoint Product Sales list. At this point, there is still connectivity between the SharePoint list and the Excel workbook, as you can see on the Design tab on the Ribbon, which shows the Refresh button that will refresh the content from the SharePoint 2010 list.
Figure 26.3. Product Sales list exported to Excel 2010.

- Click the File tab in Excel, then Save As, and save the workbook to a local folder on the computer as
Product Sales Local Copyand click Save. This reflects the manager’s desire to save the workbook locally so that he can edit it before he publishes it using Excel Services. - Navigate back to the Product Sales list in SharePoint and change a value, such as the product sold for a specific entry. This simulates the manager spotting an error in the spreadsheet and fixing it in the list.
- Return to the spreadsheet and make sure the Data tab is active and click the drop-down arrow under the Refresh All icon and select Refresh All. Verify that the spreadsheet changes to reflect the change in the SharePoint list.
- Still in Excel, click the Design tab (if not visible, click any cell that contains data in the table) and check the value of the table name in the Table Name field in the Properties section of the Ribbon on the left. It will be something similar to Table_owssvr_3. Change this to
Table_1. - Right-click the tab at the bottom of the screen and rename the active tab as
Sales Numbers. These small changes make the workbook easier to deal with when it is published using Excel Services. - Next, a pivot chart will be added for more interactive analysis of the data. Click the Insert tab on the Ribbon and then the PivotTable drop-down menu and select PivotChart.
- The Create PivotTable with PivotChart window opens. The Table/Range field should be active, and have the blinking text entry cursor in it. Click and drag to select the range of cells that includes the content under the Salesperson, Product, Quantity Sold, and Month of Sale columns, as shown in Figure 26.4. This selects a subset of the data contained in the table but leaves out the Invoice Number column, as well as Item Type column and Path column.
Figure 26.4. Selecting a data range for a PivotChart in Excel 2010.
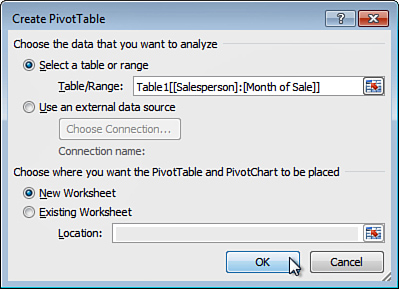
- Verify that New Worksheet is selected in the Choose Where You Want the PivotTable and PivotChart to Be Placed section. Click OK.
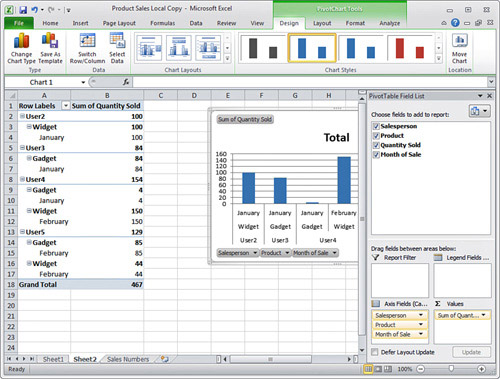
- A new worksheet will open, and the PivotTable Field List tool pane will be open on the right side of the screen. Check the Salesperson, Product, Quantity Sold, and Month of Sale check boxes in the Choose Fields to Add to Report Field, as shown in Figure 26.5.
Figure 26.5. Selecting fields to add to the report.
- Close the PivotTable Field list pane.
- Click the Save button to save the changes locally.
- Now the manager is ready to publish the workbook to a SharePoint document library using Excel Services. To accomplish this, click the File tab on the Ribbon, and then click Save & Send.
- Click Save to SharePoint from the Save & Send section, and then click Publish Options button on the right side of the screen, as shown in Figure 26.6.
Figure 26.6. Save & Send page in Excel 2010.

- The Publish Options window will open. From the Show tab, access the drop-down menu and choose Items in the Workbook.
- From the list of items that appears, select the Chart (Chart1 in this example) and PivotTable (PivotTable2 in this example) and uncheck the table (Table 1) if checked, as shown in Figure 26.7. Click OK. These are the items in the workbook that will be published to Excel Services and be available for use in the Excel Web Access web part, whereas the table will not be.
Figure 26.7. Setting the publish options for the worksheet.

- Back on the Save & Send screen, scroll to the bottom of the page and click Save As.
- The Save As window opens. Enter in the URL of the document library that the workbook will be published to, as shown in Figure 26.8. Change the name of the document to
Product Sales Q1, verify that Open with Excel in the browser is checked, and then click Save.Figure 26.8. Saving the workbook to a SharePoint 2010 document library.

- A browser window will open and display the published items from the workbook in the browser, as shown in Figure 26.9. Access the drop-down menu next to View in the upper-right corner to switch to the PivotTable to validate both components have published.
Figure 26.9. PivotChart open in the browser after publishing.

At this point in the example, components of the workbook have been published using Excel Services and they display properly in the browser. The manager, who happens to also manage the SharePoint 2010 site, now wants to display this content on the home page of the site, and so performs the following steps:
- Assuming the previous steps have been completed successfully and the items specified previously we published to SharePoint using Excel Services, return to the home page of the site that houses the document and list (http://abcsp1004/sites/Chapter26/SitePages/Home.aspx in this example) and access the Site Actions drop-down and click Edit Page.
- Click the Insert tab on the Ribbon and click the Web Part button.
- Click the Business Data icon in the Categories list of items, and then click Excel Web Access in the Web Parts section. Click Add and the Excel Web Access web part will be added to the page, as shown in Figure 26.10.
Figure 26.10. Excel Web Access web part added to a home page.

- Next, the Excel Web Access web part needs to be edited to display data. Click the link inside the Excel Web Access web part that reads Click Here to Open the Tool Pane and the tool pane will open on the right.
- Scroll to the right to expose the tool pane if needed, and click the button next to Workbook at the top. Then from the Select as Asset window, navigate to the document library that the Excel workbook was published to and select the workbook (Product Sales Q1 in this example) and click OK.
- Click Apply and the page should look like Figure 26.11. In this example, the Chart 1 PivotChart is displayed, but the PivotTable can be displayed by changing the view from the drop-down menu in the Excel Web Access web part toolbar to PivotTable 2, as shown in Figure 26.12.
Figure 26.11. Excel Web Access web part after connection to the published workbook.

Figure 26.12. Excel Web Access web part showing the PivotTable.

- Click the Page tab on the Ribbon and click Save & Close. Perform additional tasks if needed to publish the page.
- Finally, collapse the nodes in the PivotTable view and then switch to the Chart1 view and note that it reflects the change in the PivotTable and now only displays a single column per salesperson, as opposed to multiple columns per salesperson when the PivotTable nodes are expanded. Note that none of the cells can be edited in the Excel Web Access web part.
Note
The Excel Web Access web part offers a handy tool in the File tab: the Reload Workbook tool. This will reload the workbook to Excel Services, which may sometimes be needed because content is cached and the version being viewed might not reflect all the most recent changes.
This exercise shows an example of how Excel Services can be used by a manager to publish certain items from a workbook a document library, and then the Excel Web Access web part can be added to a page to allow users to interact with a PivotTable and see the results on a PivotChart but not change the actual data itself.
Additional experimentation with the different tools provided in the Excel Web Access web part is encouraged, as well as additional modifications to the data in the SharePoint list, which is still connected to the spreadsheet, so can be refreshed when the SharePoint 2010 list changes and then republished to the SharePoint document library via Excel Services.