
Chapter 7
Extreme Values, Quantiles, and Value at Risk
Extreme price movements in the financial markets are rare but important. The stock market crash on Wall Street in October 1987 and other big financial crises such as the Long-Term Capital Management and the bankruptcy of Lehman Brothers have attracted a great deal of attention among investors, practitioners, and researchers. The recent worldwide financial crisis characterized by the substantial increase in market volatility, for example, the volatility index (VIX) of the Chicago Board Options Exchange index, and the big drops in market indices has further generated discussions on market risk and margin setting for financial institutions. As a result, value at risk (VaR) has become the standard measure of market risk in risk management. Its usefulness and weaknesses are widely discussed.
In this chapter, we discuss various methods for calculating VaR and the statistical theories behind these methods. In particular, we consider the extreme value theory developed in the statistical literature for studying rare (or extraordinary) events and its application to VaR. Both unconditional and conditional concepts of extreme values are discussed. The unconditional approach to VaR calculation for a financial position uses the historical returns of the instruments involved to compute VaR. On the other hand, a conditional approach uses the historical data and explanatory variables to calculate VaR. The explanatory variables may include macroeconomic variables of an economy and accounting variables of companies involved.
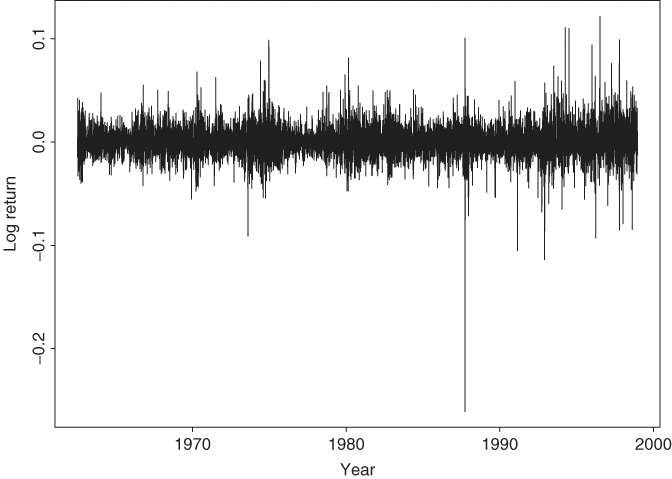
Other approaches to VaR calculation discussed in the chapter are RiskMetrics, econometric modeling using volatility models, and empirical quantile. We use daily log returns of IBM stock to illustrate the actual calculation of all the methods discussed. The results obtained can therefore be used to compare the performance of different methods. Figure 7.1 shows the time plot of daily log returns of IBM stock from July 3, 1962, to December 31, 1998, for 9190 observations.
Figure 7.1 Time plot of daily log returns of IBM stock from July 3, 1962, to December 31, 1998.
VaR is a point estimate of potential financial loss. It contains a certain degree of uncertainty. It also has a tendency to underestimate the actual loss if an extreme event actually occurs. To overcome the weaknesses of VaR, we discuss other risk measures such as expected shortfalls and the loss distribution of a financial position in the chapter.