Relational and Dimensional Conceptual Data Models
Recall from this section introduction that relational data modeling is the process of capturing how the business works by precisely representing business rules, while dimensional data modeling is the process of capturing how the business is monitored by precisely representing navigation. There are both relational and dimensional conceptual data models.
Relational CDM Example
The relational conceptual model includes concepts, their definitions, and the relationships that capture the business rules binding these concepts. Unlike the logical and physical data models, as we will see, conceptual models may contain many-to-many relationships. For example, Figure 8.3 contains part of a financial relational CDM.
Figure 8.3 Financial relational CDM subset

Following is a full list of the concept definitions that we arrived at from our meetings with the project sponsor:
|
Customer |
A customer is a person or organization who obtains our product for resale. A person or organization must have obtained at least one product from us to be considered a customer. That is, prospects are not customers. Also, once a customer, always a customer so even customers that have not obtained anything in 50 years are still considered customers. The customer is different than the consumer, who purchases the product for consumption as opposed to resale. |
|
Account |
An account is a contractual arrangement by which our bank holds funds on behalf of a customer. |
|
Account Balance |
An account balance is a financial record of how much money a customer has with our bank at the end of a given time period, such as someone’s checking account balance at the end of a month. |
Business Rules (listed in the order we would typically walk someone through the model):
· Each Customer may own one or many Accounts.
· Each Account must be owned by one or many Customers.
· Each Account may contain one or many Account Balances.
· Each Account Balance must belong to one Account.
Notice that in this example definitions were not displayed directly on the diagram such as the model in Figure 8.1. I find that if the data model is small enough (and the definitions are short enough), it can be a valuable communication tool to display the definitions on the diagram. I also choose to display the definitions when I need to highlight poor or lacking definitions, or definitions that I know will spur debate.
Dimensional CDM Example
To understand and document our reporting requirements, we can also build a dimensional CDM, such as the example in Figure 8.4.
Figure 8.4 Financial dimensional CDM using the same notation used for relational CDM

In this case, we’d like to see certain measures around account balances (such as Account Balance Amount) at a Region, Account, and Month level and then have the ability to navigate to higher levels, such as viewing Account Balance Amount at a Country level. We take measures such as Account Balance Amount up and down hierarchies. A hierarchy is when an entity instance is a child of an most one other entity instance, such as the month January 2013 belonging to only the year 2013.
Concept definitions:
|
Account Balance |
An account balance is a financial record of how much money a customer has with our bank at the end of a given time period, such as someone’s checking account balance at the end of a month. |
|
Country |
A country is a recognized nation with its own government, occupying a particular territory, which is included in the ISO country code listing. |
|
Region |
A region is our bank’s own definition of dividing a country into smaller pieces for branch assignment or reporting purposes. |
|
Customer |
A customer is a person or organization who obtains our product for resale. A person or organization must have obtained at least one product from us to be considered a customer. That is, prospects are not customers. Also, once a customer, always a customer so even customers that have not obtained anything in 50 years are still considered customers. The customer is different than the consumer, who purchases the product for consumption as opposed to resale. |
|
Account |
An account is a contractual arrangement by which our bank holds funds on behalf of a customer. |
|
Year |
A year is a period of time containing 365 days, consistent with the Gregorian calendar. |
|
Month |
A month is each of the twelve named periods into which a year is divided. |
The model in Figure 8.4 was created using the same symbols we used for the relational, which is called Information Engineering (IE) notation. ER/Studio contains a separate set of symbols we can use to build the dimensional model, as shown in Figure 8.5.
The relationship lines have the same appearance as in Figure 8.4, yet the entities appear as bub-tangles. There are several different types of entities on a dimensional model, each type distinguished with a different icon.
Figure 8.5 Financial dimensional CDM using dimensional notation
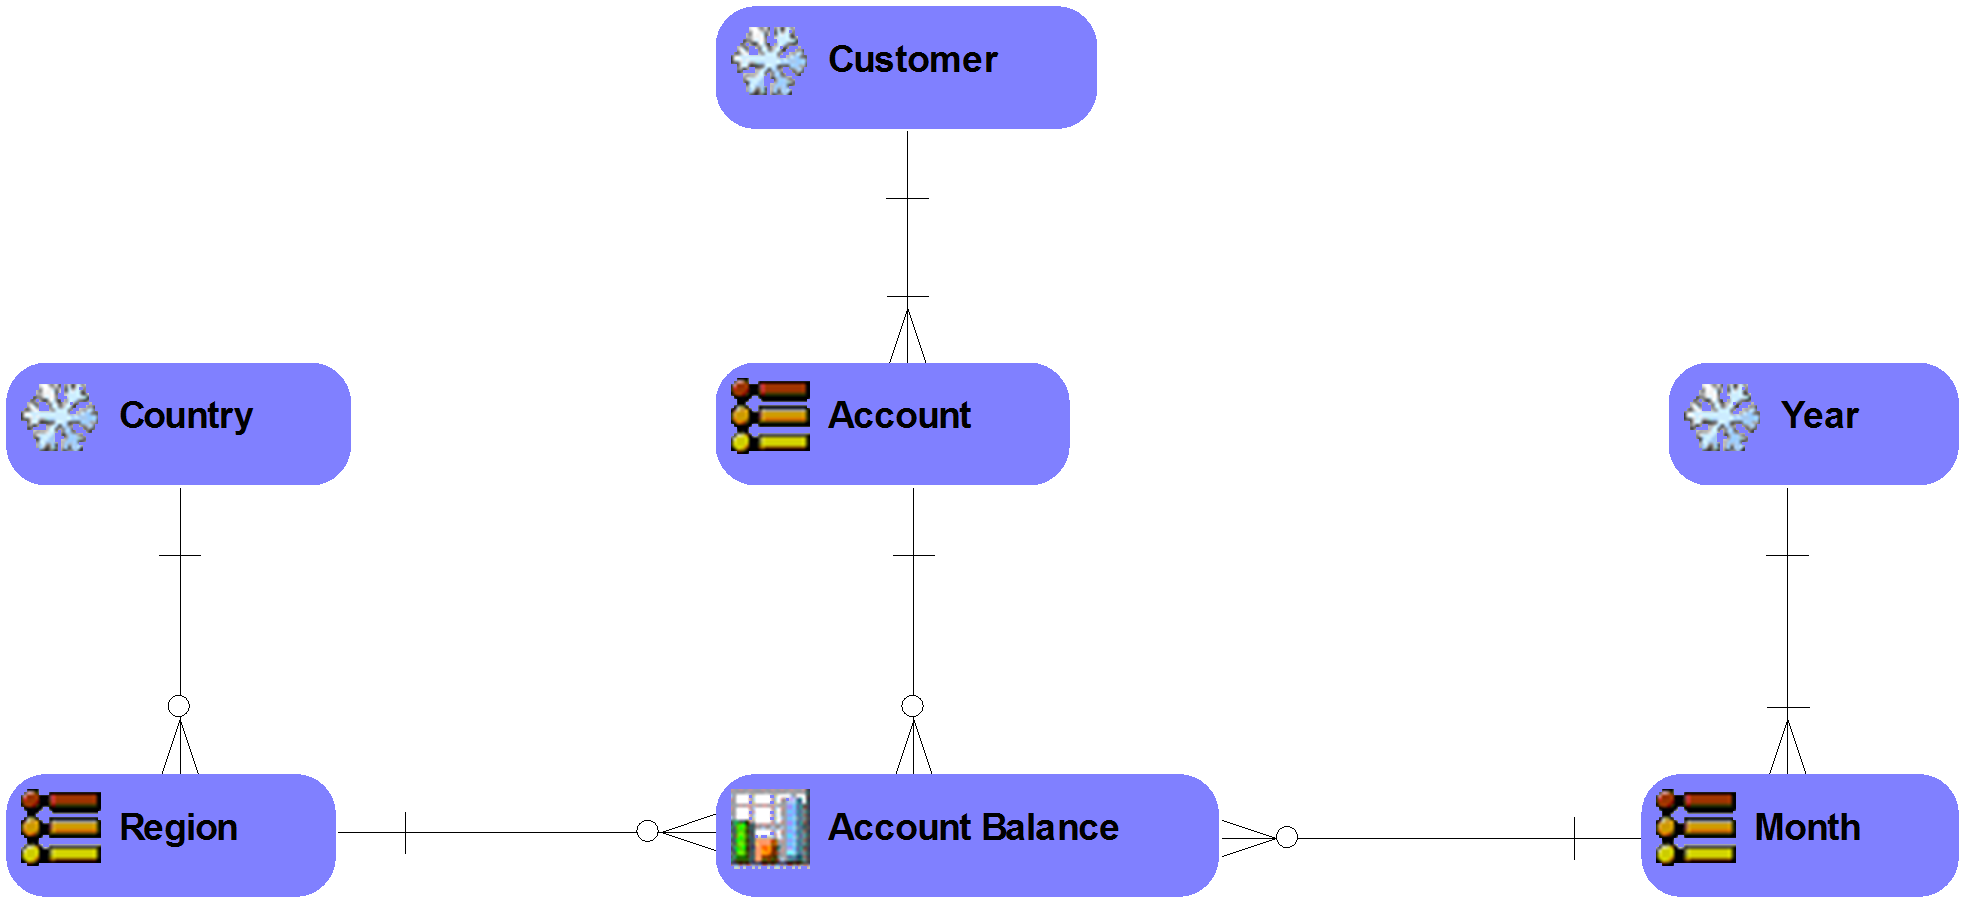
Account Balance is an example of a fact table (on a conceptual and logical data model often called a “meter”). The icon for a meter in ER/Studio is the graph symbol, because we are measuring something. A meter is an entity containing a related set of measures. It is not a person, place, event, or thing, as we find on the relational model. Instead, it is a bucket of common measures. As a group, common measures address a business concern, such as Profitability, Employee Satisfaction, or Sales. The meter is so important to the dimensional model that the name of the meter is often the name of the application. The Sales meter, the Sales Data Mart.
Region, Account, and Month are examples of dimensions, distinguished by the three horizontal lines icon. A dimension is a subject whose purpose is to add meaning to the measures. All of the different ways of filtering, sorting, and summing measures make use of dimensions.
Country, Customer, and Year are examples of snowflakes, distinguished by the snowflake icon. These are higher levels in a hierarchy. A hierarchy is when a higher level can contain many lower levels, but a lower level can belong to, at most, one higher level. These higher levels indicate that we can view the measures in the meter at these levels as well. For example, we can view Account Balance Amount at the Country, Customer, and Year level.
We will explain additional dimensional terminology in Chapter 9, Logical Data Models. When I build a dimensional data model, I use the notation I think my audience will best understand. I will use the IE notation when my audience is already very familiar with this modeling notation from the relational data models, and often use the dimensional data modeling notation when my audience is less familiar with data modeling.