Creating a Dimensional Logical Data Model
Recall the dimensional data model from earlier in this chapter, repeated here with slightly more detail, in Figure 9.10.
In a dimensional model, each table is assigned a Table Model type, which is distinguished by an icon displayed in the upper left corner of the entity or table box. You can further define a table in the Table Editor by assigning it a Table Type that displays at the bottom of the table (e.g. Fixed). The Table Type does not change how the data is handled but provides information to the reader about the data in the table. It is purely for documentation purposes.
Figure 9.10 Financial dimensional LDM
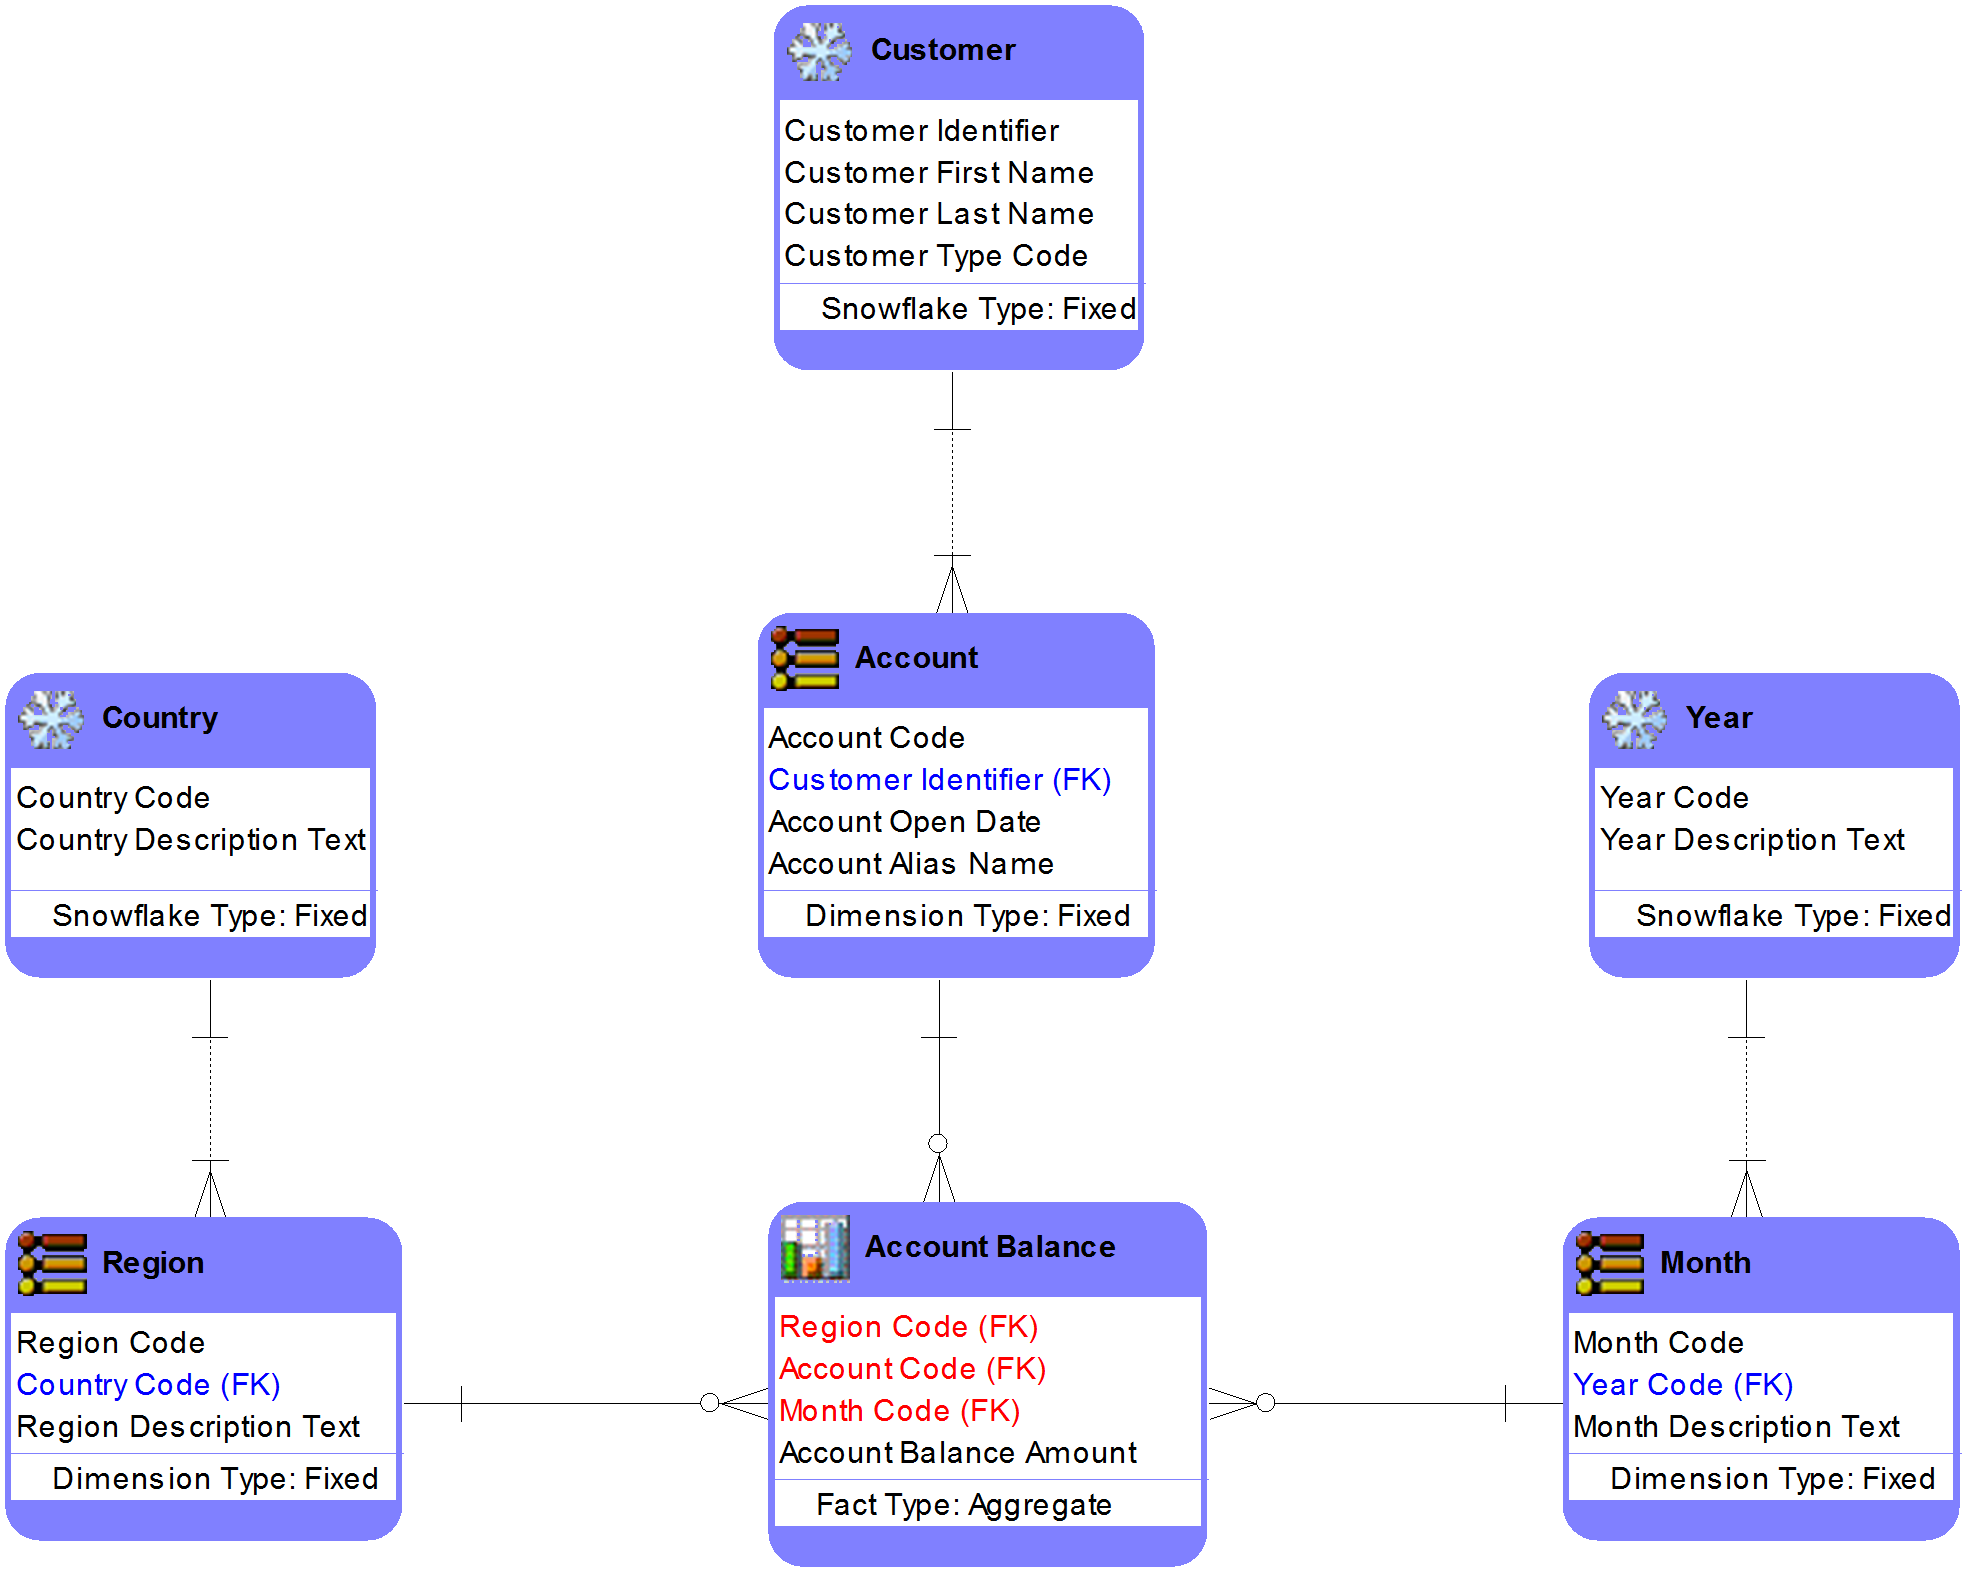
Account Balance is an example of a fact table (on a conceptual and logical data model it is often called a “meter”). The icon for a meter in ER/Studio is the graph symbol because we are measuring something. A meter is an entity containing a related set of measures. It is not a person, place, event, or thing, as we find on the relational model. Instead, it is a bucket of common measures, in this case, just the measure Account Balance Amount. As a group, common measures address a business concern, such as Profitability, Employee Satisfaction, or Sales. A fact table can be further classified into one these four types:
· Aggregate. Also known as a summarization, an aggregate contains information that is stored at a higher level of granularity than translation level details. Aggregates provide quick access to data and can be very user-friendly structures for users and reporting tools. Account Balance in our example is an aggregate.
· Atomic. Contains the lowest level of detail available in the business, often the same level of detail that exists in operational systems, such as order entry systems. An example of an atomic fact in this same account balance subject area would be the individual bank account withdrawal and deposit transactions.
· Cumulative. Also known as accumulating, cumulative captures how long it takes to complete a business process. For example, tracking how long it takes from application through completion of a home mortgage application would be represented in a cumulative fact.
· Snapshot. Contains time-related information that details specific steps in the life of the entity. For example, snapshot information for a sale could contain information such as when the order was created, confirmed, shipped, delivered, and paid for.
Region, Account, and Month are examples of dimensions, distinguished by the three horizontal lines icon. A dimension is a subject whose purpose is to add meaning to the measures. All of the different ways of filtering, sorting, and summing measures make use of dimensions. Dimensions have their own attributes. A dimension can be further classified into one these six types:
· Fixed Dimension. Also known as a Type 0 Slowly Changing Dimension (SCD for short), a fixed dimension contains values that do not change over time. For example, Gender is a fixed dimension containing the values Male and Female.
· Degenerate. A dimension whose attribute(s) have been moved to the fact table. A degenerate dimension is most common when the original dimension contained only a single data attribute such as a transaction identifier like an Order Number.
· Multi-Valued. A multi-valued dimension can help you model a situation where there are multiple values for an attribute or column. For example, a health care bill can have a line item of Diagnosis, for which there could be multiple values. Best practice modeling dictates that there should be a single value for each line item. To model this multi-valued situation, you could create a multi-valued table that captures the diagnosis information and weighs each diagnosis, so that the total adds up to one.
· Ragged. In a ragged dimension, the parent of at least one member is missing from the level immediately above the member. Ragged dimensions allow for hierarchies of indeterminate depth, such as organizational charts and parts explosions.
· Shrunken. A shrunken table is a version of the fact table which often contains attributes which are not measures. It is often used when there are large text strings that are at the same level of detail as the fact table, and are stored in a separate table for space or query efficiency reasons.
· Slowly Changing Type 0 through 6. Slowly Changing Dimension (SCD) Type 0 is equivalent to the fixed dimension concept where values do not change over time. SCD Type 1 means we are only storing the current view and ignoring history. SCD Type 2 means we want all history (Type 2 is the Time Machine). SCD Type 3 means we want some history, such as the most current state and the previous state, or the most current state and the original state. SCD Type 6 is when we have a complex dimension with varying history needs, such as part of the dimension is a Type 1, part is a Type 2, and part is a Type 3 (1 + 2 + 3 = 6). Types 0, 1, 2, and 3 are the building blocks for more advanced history requires, such as the Type 6.
Country, Customer, and Year are examples of snowflakes, distinguished by the snowflake icon. These are higher levels in a hierarchy. A hierarchy is when a higher level can contain many lower levels, but a lower level can belong to at most one higher level. These higher levels indicate that we can view the measures in the meter at these levels as well. For example, we can view Account Balance Amount at the Country, Customer, and Year level. Snowflakes can also have their own attributes. Snowflakes can be further classified using the same descriptors as just mentioned with dimensions.
|
Key Points · A logical data model (LDM) represents a detailed business solution. · A relational logical data model represents how the business works. A dimensional logical data model represents what the business is monitoring. · Normalizing is a formal process of asking business questions. Normalization ensures that every attribute is a fact about the key (1NF), the whole key (2NF), and nothing but the key (3NF). · Abstraction brings flexibility to your logical data models by redefining and combining some of the attributes, entities, and relationships within the model into more generic terms. · There are a number of important terms unique to dimensional modeling, including meters and dimensions. · There are different types of meters, including aggregate, atomic, cumulative, and snapshot. · There are different types of dimensions, including fixed dimension, degenerate, multi-valued, ragged, shrunken, snowflake, bridge, hierarchy navigation, and undefined. |