
A data table, or sensitivity table, summarizes the impact of one or two variables on formulas that use those variables. You can click the What-If Analysis button in the Data Tools group on the Data tab and then click Data Table to create two kinds of data tables: tables based on a single input variable that test the variable’s impact on more than one formula, and tables based on two input variables that test their impact on a single formula.
Note
Some of the most powerful tools Excel offers for performing what-If analysis are not covered in this chapter because they are awesome enough to have a chapter of their own. Take a look at Chapter 23 for a comprehensive look at PivotTables and the new PowerPivot feature. These tools give you superhuman powers over mass quantities of data, providing easy access to giant databases and allowing you to slice and dice the data any way you like.
Suppose you’re considering buying a house that requires you to take on a 30-year, $200,000 mortgage, and you need to calculate monthly payments on the loan for several interest rates. A one-variable data table, such as the one shown in Figure 18-1, can give you the information you need.
To create this table, type the interest rates you want to test, as shown in cells B3:B9 in Figure 18-1. This is the input range because it contains the input values you want to test. Type the loan amount in a cell outside the data table area. We typed $200,000 in cell C1. This allows us to easily change the loan amount to test various scenarios. Enter the formula that uses the input variable. In this case, type the formula =PMT(A2/12, 360, C1) in cell C2. In this formula, A2/12 is the monthly interest rate, 360 is the term of the loan in months, and C1 refers to the cell containing the loan principal.

Figure 18-1. Begin building the data table by typing the interest rates, the loan amount, and the PMT function in the worksheet.
Note
Notice that the formula in cell C2 refers to cell A2, which is blank. Because A2 is blank, the function returns a spurious result: the payment required to amortize the loan at an interest rate of 0 percent. This is a data table quirk, if you will. Cell A2 is a “placeholder” through which Excel feeds the values in the input range to create the data table. You need to designate a blank cell for this purpose. Because Excel never changes the underlying value of this cell, this placeholder cell can be anywhere, as long as it is outside the data table.
After you enter the inputs and the formula, select the data table—the smallest rectangular block that includes the formula and all the values in the input range. In this case, select the range B2:C9. Click the What-If Analysis button in the Data Tools group on the Data tab, and then click Data Table.
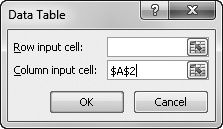
In the Data Table dialog box, shown in Figure 18-2, specify the location of the input cell in the Row Input Cell or Column Input Cell box. The input cell is the placeholder cell referred to by the table formula—in this example, A2. If the input values are arranged in a row, type the input cell reference in the Row Input Cell box. If the values in the input range are arranged in a column, as in our example, use the Column Input Cell box.
After you click OK, Excel enters the results of the table formula (one result for each input value) in the available cells of the data table range. In this example, Excel enters six results in the range C3:C9, as shown in Figure 18-3, with a little formatting we added for easier reading.
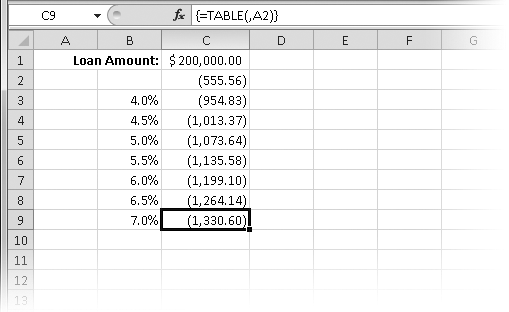
When you create this data table, Excel enters the array formula { =TABLE(,A2)} in each cell in the results range C3:C9. In the sample data table, the formula computes the results of the PMT function by using each of the interest rates in column B. After you build the table, you can change the loan amount or any of the interest rate values to see the results immediately.
When you create a single-variable data table, you can include as many output formulas as you want. If your input range is in a column, type the second output formula directly to the right of the first one, the third to the right of the second, and so on. You can use different formulas for different columns, but they must all use the same input cell.
Suppose you’re thinking about buying a house that would require you to take out a $180,000 mortgage. You want to know what your monthly payments would be on that mortgage at each of the interest rates in the input range, and you want to be able to compare these payments with those for the $200,000 mortgage calculated in Figure 18-3. You can expand the table in Figure 18-3 to include both formulas.
To add a formula to the data table, type the new formula in cell D2. For this example, we typed =PMT(A2/12, 360, D1). This formula must also refer to cell A2, the same input cell as in the first formula. Then type $180,000 in cell D1, and select the table range B2:D9. Then click the What-If Analysis button on the Data tab, and click Data Table. Finally, type the same input cell reference ($A$2) in the Column Input Cell box and click OK. Figure 18-4 shows the result.

Suppose you want to build a data table that computes the monthly payment on a $200,000 mortgage, but this time you want to vary not only the interest rate but also the term of the loan. You want to know what effect changing the interest rate and the term have on your monthly payment.
To create this table, you can again type seven interest rates in cells B3:B9. Then type the second set of input values—the loan terms, in months—in a row above and to the right of the first set, as shown in Figure 18-5.

After you type the loan amount in a cell outside the table area (cell I2 in this example), you can create the table formula. Because this is a two-variable table, you must type the formula in the cell at the intersection of the row and column that contain the sets of input values—cell B2, in this example. Although you can include as many formulas as you want in a single-variable data table, you can include only one output formula in a two-variable table. The formula for the table in this example is =PMT(A2/12, B1, I2).
You’ll notice immediately that the formula in cell B2 returns an error value because of the two blank “placeholder” cells, A2 and B1. As you’ll see, this spurious result does not affect the performance of the table.
Finally, select the data table—the smallest rectangular block that includes all the input values and the table formula. In this example, the table range is B2:F9. Click the What-If Analysis button on the Data tab, then click Data Table, and finally specify the (empty) input cells. Because this is a two-variable table, you must define two input cells. For this example, type the reference for the first input cell, $B$1, in the Row Input Cell box, and then type the reference for the second input cell, $A$2, in the Column Input Cell box. Figure 18-6 shows the result.

TROUBLESHOOTING
The results in my two-input data table are wrong.
Be careful not to reverse the input cells in a two-variable table. If you do, Excel uses the input values in the wrong place in the table formula, which creates a set of meaningless results. For example, if you reverse the input cells in the example shown in Figure 18-6, Excel uses the values in the input range C2:F2 as interest rates and the values in the input range B3:B9 as terms, resulting in monthly payments in the $20 million range!
To be sure you’re using the correct input cells, look at the formula. In our example, =PMT(A2/12, B1, I2), A2 appears in the first argument, which is rate. Because the rates are arranged in a column, A2 is the column input cell.
Although you can edit the input values or formulas in the left column or top row of a table, you can’t edit the contents of any individual cell in the results range because the data table is an array. If you make a mistake when you set up a data table, you must select all the results, press the Delete key, and then recompute the table.
You can copy the table results to a different part of the worksheet. You might want to do this to save the table’s current results before you change the table formula or variables. In Figure 18-7, we copied the values from C3:F9 to C10:F16. When you do this, the copied values are constants, not array formulas. Excel automatically changes the results of the table from a set of array formulas to their numeric values if you copy the results out of the table range.
