
To model more complicated problems than data tables can handle—those involving as many as 32 variables—you can call on the services of the Scenario Manager by clicking the What-If Analysis button in the Data Tools group on the Data tab and then clicking Scenario Manager. A scenario is a named combination of values assigned to one or more variable cells in a what-if model. The worksheet in Figure 18-8 is a what-if model set up so you can type variable figures and watch the effect on dependent computed values. The Scenario Manager records, tracks, and applies combinations of variable values.
Here are some of the tasks you can do with the Scenario Manager:
Create multiple scenarios for a single what-if model, each with its own sets of variables. You can create as many scenarios as your model requires.
Distribute a what-if model to other members of your group so they can add their own scenarios. Then you can collect the multiple versions and merge the scenarios into a single worksheet.
Track changes made to scenarios with the version-control features of the Scenario Manager. This feature lets you record the date and the user name each time a scenario is added or modified.
Print reports detailing all the changing cells and result cells.
Password-protect scenarios from modification, and even hide them from view.
Examine relationships between scenarios created by multiple users by using Scenario Summary and PivotTable reports. For more about PivotTables, see Chapter 23.

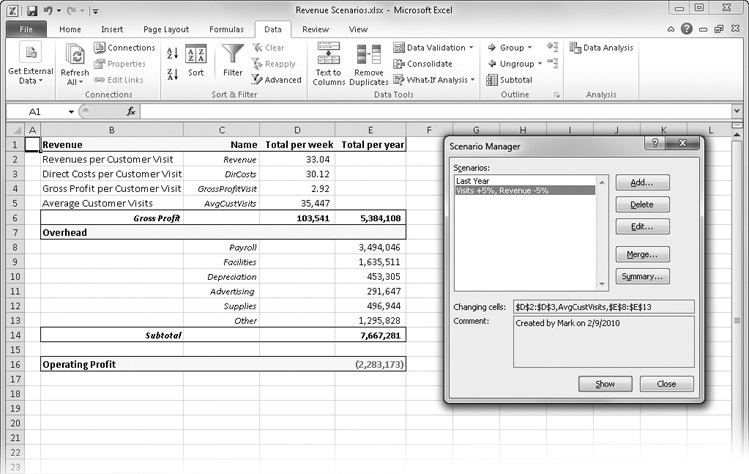
Figure 18-8. We’ll use the Scenario Manager to model the effects of changing values in D2:D3, D5, and E8:E13 of this worksheet.
Imagine that you manage a grocery store whose profit picture is modeled by the worksheet in Figure 18-8. The numbers in D2:D5 and E8:E13 are historic averages; column C contains the range names applied to the relevant cells in columns D and E. You’re interested in testing the impact of changes in these cells on the bottom line in cell E16.
Note
Cell references are OK, but before you begin using the Scenario Manager, it’s a good idea to name the cells you plan to use for your variables, as well as any cells containing formulas whose values depend on your variable cells. This step isn’t required, but it makes the scenario reports, as well as some of the dialog boxes, more intelligible. For more information, see Naming Cells and Cell Ranges on page 483.
We’ll create different sets of assumptions for the model shown in Figure 18-8 and save each one as a different scenario. To define a scenario, follow these steps:
Click the What-If Analysis button on the Data tab, and then click Scenario Manager.
In the Scenario Manager dialog box, shown in Figure 18-9, click Add. (Note that the sample file already contains defined scenarios, so this dialog box may look different.)
In the Add Scenario dialog box, shown in Figure 18-9, type a name for your scenario. (Note that as soon as you type cell references in the Add Scenario dialog box, the title of the dialog box changes to Edit Scenario.)
Note
It’s a good idea to define the values you begin with as a scenario before changing any of them. You can name this scenario something like Starting Values or Last Year, as in our example. If you don’t name the starting scenario, you’ll lose your original what-if assumptions when you display the new changing cell values on your worksheet.
In the Changing Cells box, type or select the cells you plan to vary. Select nonadjacent cells and ranges by pressing the Ctrl key before selecting the cells or by separating their references or names with commas, as shown in Figure 18-10.
Figure 18-10. Here we entered the references of the changing cells individually by clicking cells and ranges, separating each reference from the next with a comma.
Note
The Prevent Changes option in the Add Scenario dialog box is selected by default. As you might expect, it protects the selected scenario from modification, but only after you click Protect Worksheet on the Review tab. Similarly, clicking the Hide option removes the selected scenario from the list of scenarios offered in the Scenario Manager dialog box, but only if worksheet protection has been activated.
Click OK to create the first scenario. The Scenario Values dialog box appears, displaying a box for each changing cell. If you have named the changing cells, the names appear adjacent to the boxes, as shown in Figure 18-11; otherwise, the references of the changing cells appear.
To complete a scenario, edit these values; however, for this example, leave the values as they are, and just click OK.
Figure 18-11. Because we previously named each changing cell, the names appear in the Scenario Values dialog box.
Note
In each text box in the Scenario Values dialog box, you can type either a constant or a formula. For example, to increase the value of the first variable in Figure 18-11, click in front of the value in the first variable’s box, and type =1.1* to create a formula that multiplies the current value by 1.1. (Note that although you can type formulas in the Scenario Values dialog box, Excel alerts you that the formulas are converted to their resulting values after you click OK.)
To create another scenario, click Add to return to the Add Scenario dialog box.


Select a scenario name in the Scenario Manager dialog box, and click Show. The Scenario Manager replaces the variable values currently on the worksheet with the values you specified when you created the scenario. In Figure 18-12, the example worksheet has a scenario showing average customer visits increased by 5 percent and revenues per customer visit decreased by 5 percent.
The Scenario Manager dialog box remains on the screen after you click the Show button so you can look at the results of other scenarios without returning to the worksheet. If you click Close or press Esc to close the Scenario Manager dialog box, the values from the last scenario you browsed remain on the worksheet. (This is a good reason to create a starting values scenario, as mentioned earlier.)
Excel saves scenarios with all other data when you save the workbook. Each worksheet in a workbook can contain its own set of scenarios. In the Scenario Manager dialog box, you add new scenarios by clicking Add, and you edit existing scenarios by clicking Edit, which displays the Edit Scenario dialog box (which is functionally the same as the Add Scenario dialog box shown in Figure 18-9). You can change the name of the selected scenario, add or remove changing cells, or add comments in the Edit Scenario dialog box.
If someone edits a scenario, Excel adds a Modified By entry to the Comment box in the Scenario Manager dialog box, beneath the Created By entry that appears when you first add a scenario. Each time a scenario is modified, Excel adds the name of the user and the date of modification. This information is particularly helpful if you route your what-if models to others and then merge their scenarios into a single what-if model, as discussed in the following section.
Tip
INSIDE OUT Comment Modifications
When you edit scenarios, you can modify the contents of the Comment box; those modifications persist in all dialog boxes, including the creation and modification dates. You might not want to permit users to modify the Comments if you really want to track changes or prevent tampering. If you don’t want these comments modified, make sure you take advantage of the preventative measures discussed in Protecting Worksheets on page 170.
If part of your job is to develop what-if models or projections for your company, you probably spend a lot of time gathering information about trends and market forces that might affect the company in the future. Often you need input from several people, each of whom knows about a particular aspect of the business, such as payroll costs or sales trends. Excel includes a scenario-merging feature to make this sort of information gathering easier.
For example, suppose you want to distribute a what-if model to your coworkers: Vicki has expertise about customer trends, Max knows the payroll story, and Regina keeps track of advertising. You can distribute individually named copies of the workbook to each person, and after your coworkers add their what-if scenarios and return the workbook or workbooks, you can merge the scenarios into a master worksheet. Simply open all the workbooks containing the scenarios you want, open the worksheet where you want the result to go, and click Merge in the Scenario Manager dialog box. When you do, a dialog box like the one in Figure 18-13 appears.

Figure 18-13. Clicking Merge in the Scenario Manager dialog box displays the Merge Scenarios dialog box, with which you can import scenarios from any worksheet in any open workbook.
Tip
INSIDE OUT Request Only the Data You Need
Merging scenarios works best if the basic structure of all the worksheets is identical. Although this uniformity isn’t a strict requirement, merging scenarios from worksheets that are laid out differently can cause changing cell values to appear in unexpected locations. For this reason, and because it’s generally difficult to ascertain the skill level of everyone contributing data, you might try a different approach. Distribute a questionnaire requesting only the data you need, use external cell references to link the requested data with the appropriate locations on your master worksheet, and create the scenarios yourself.
In the Merge Scenarios dialog box, you select the workbook and worksheet from which you want to merge scenarios. As shown in Figure 18-13, if you select a worksheet in the Sheet list, a message at the bottom of the dialog box tells you how many scenarios exist on that worksheet. When you click OK, the scenarios on that worksheet are copied to the active worksheet. After merging all the scenarios from your coworkers, the Scenario Manager dialog box for this example looks like the one shown in Figure 18-14.
Notice in Figure 18-14 that the Comment box displays the name of the creator and modifier of the selected scenario. If the Scenarios list includes similarly named scenarios, Excel appends a creator name, date, or number to the name. You can use the Edit button to rename the scenarios if you want.

Each group of scenarios provided by the coworkers uses different changing cells. Vicki’s scenarios change the values in cells D2, D3, and D5; Max’s scenarios change only the value in E8; and Regina’s scenarios change only the value in E11. You can display these different scenarios together and watch how the combinations affect the bottom line.
The Revenue Scenarios workbook with its merged scenarios has become a somewhat complex what-if model. However, you can create models that are far more complex, using as many scenarios as you want (or as many as your computer can handle) and up to 32 variables per scenario. The Scenario Manager summary reports help you keep track of the possibilities, and PivotTable reports give you additional what-if functionality by allowing you to manipulate the elements of the report. However, although you can create as many scenarios as you like, the Scenario Summary report displays only the first 251 of them.
Clicking Summary in the Scenario Manager dialog box displays the dialog box shown in Figure 18-15. Use it to create reports that show the values that each scenario assigns to each changing cell.
At the bottom of the dialog box, you identify result cells that you want to appear in the report, separated by commas. You want cells that are dependent on the most changing cells—in this case, the Operating Profit value in cell E16, as well as cell E6, the yearly Gross Profit value.
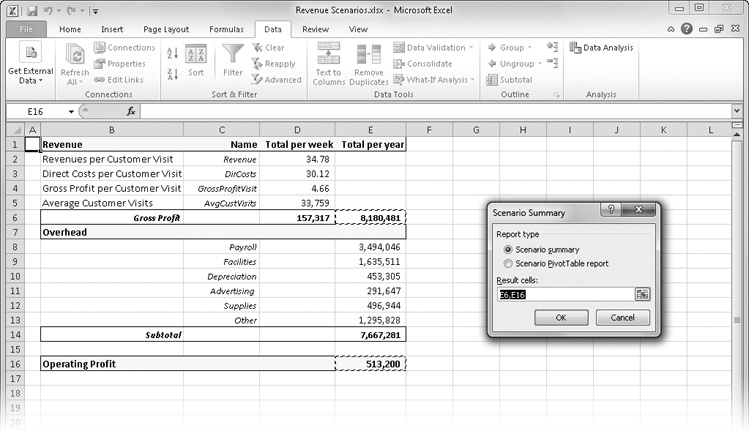
Figure 18-15. Use the Scenario Summary dialog box to specify the type of report and the result cells you want to see.
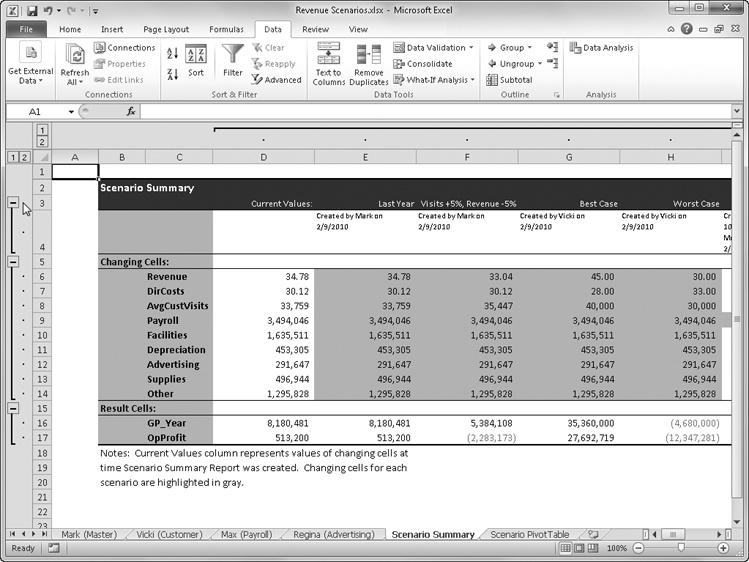
The Scenario Summary is a fully formatted report placed on a new worksheet, as shown in Figure 18-16. Notice that all the changing cell values in column E are shaded in gray. The shading indicates cells that change in the scenario named at the top of the column.

Figure 18-16. The Scenario Summary option creates a report on a new worksheet named Scenario Summary.
Notice also that outlining symbols appear above and to the left of the summary report, allowing you to show and hide details. As you can see in Figure 18-17, clicking the outline plus sign symbol displays hidden data—the contents of the Comment box in the Scenario Manager dialog box, including the creation and modification dates of each scenario.
Note
For information about working with worksheet outlines, see Outlining Worksheets on page 274.
Like the Scenario Summary report, the Scenario PivotTable report is created as a new worksheet in your workbook. However, PivotTables are what-if tools in their own right that allow you to use direct mouse-manipulation techniques to mix and match different scenarios in the report and watch the effects on result cells. Figure 18-18 shows a Scenario PivotTable report created from a version of the Revenue Scenarios workbook.
Note
For information about how to use PivotTables, see Chapter 23.
