
Chapter 28
Configuring Visio Services
Microsoft Visio 2010 is not available as part of Microsoft Office and must be purchased separately if you want to use the diagramming tool. Visio Premium or Professional 2010 enables you to create interactive data-driven diagrams and can also be used to visualize SharePoint workflows. Integration between SharePoint and Visio 2010 has been improved with the release of the 2010 product versions and SharePoint can now work directly with Visio using the browser and the Visio Graphics Service. If you are going to create a workflow, you will eventually need SharePoint Designer, but a picture is worth a thousand words and Visio is a great tool for visualizing workflows for many non-SharePoint users.
This lesson provides a broad overview of the Visio service and how you can enable it and begin to use its features to work with SharePoint and in particular SharePoint Workflows.
For existing Visio users, the Visio Graphics Service offers a way to expose diagrams in the browser without having to worry if the user has the client or viewer installed. Figure 28.1 shows a sample Visio 2010 web diagram in a SharePoint document library.

When you simply store a Visio file in SharePoint, it is saved as a web drawing which is the file that you actually view in the browser. It is rendered using the Visio Graphics Service. In addition to displaying the web drawings directly in the browser, Visio can also show them using the Visio Web Part. Figure 28.2 shows this Web Part in action. Web drawings are supported by Visio Graphics Service and SharePoint 2010, and the end user does not need to have the Visio client or viewer to see them.
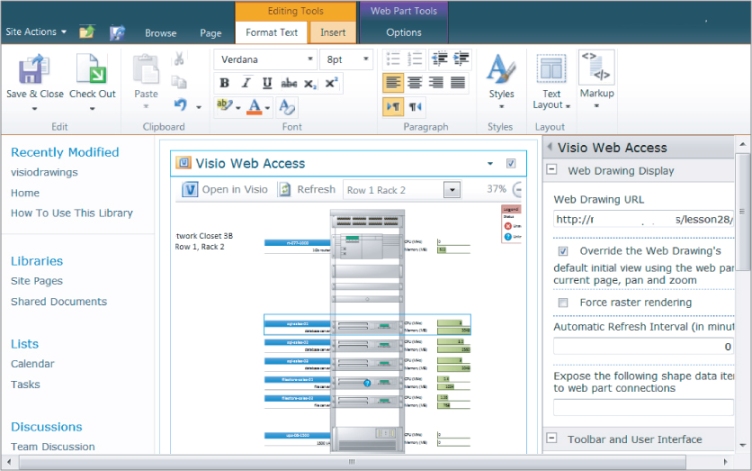
Many features of Visio are available to you when you view the document in the browser, and working with the Visio Web Part does give you some control over how the document is presented and the functionality available. Using the Web Part properties, you can do the following:
- Enable or disable data refresh
- Allow the user to open the diagram in Visio
- Display page navigation
- Show shape information
- Show a diagram's background
Visio Process Repository
A specific document library for storing Visio process documents is available in SharePoint. This library contains all the standard document library features in SharePoint, and some Visio-specific columns and content types. The process used to create a Visio Process Repository library is exactly the same as creating a standard Document Library, and you can give it any meaningful name. Figure 28.3 shows the document templates available in the document library that can be used to create documents in Visio 2010.
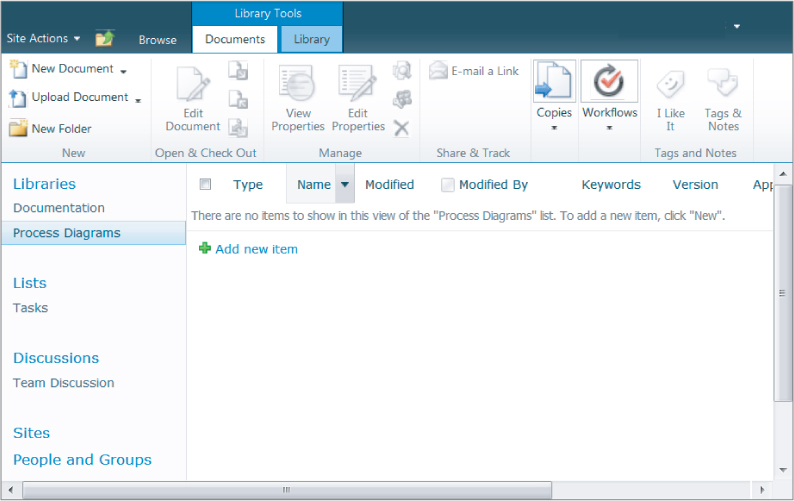
The following document templates are available within the Visio library:
- Basic Flowchart (metric)
- BPMN Diagram (metric)
- Cross Functional Flowchart (metric)
- BPMN Diagram (US Units)
- Cross Functional Flowchart (US units)
Selecting a template can open the particular file in Microsoft Visio 2010, and make it ready for you to begin the design process.
Data-Driven Diagrams
In addition to static Visio drawings, data-driven drawings are also supported by the Graphics Service. The following data sources are supported on SharePoint:
- Excel (the workbook must also be stored in the same site)
- SQL Server tables and views
- SharePoint lists
- Recent OLE DB/ODBC drivers
Visio Graphics Application
The graphics application is configured within Central Administration under Manage Service Applications. A limited number of configuration settings are required:
- Global Setting: Settings that deal with performance, security, and how data connections are refreshed. Within this category you can set the maximum drawing size allowed, the length of time a web drawing is cached in memory, and the length of time before the cache is cleared. In terms of controlling data connections you can set the number of seconds before a data refresh times out and set an unattended service account for the service.
- Trusted Data Providers: Provides a listing of all data providers trusted by default and enables you to add providers to this list. You will find SQL Server, Oracle, SharePoint Lists, and Excel Web Services already listed.
As you can see, not many configuration options are available to you at this time, but as you might guess, more will become available as developments in SharePoint and Visio continue.
SharePoint Designer and Visio 2010
Visio 2010 enables you to visualize a SharePoint workflow and take that visualization into SharePoint designer to add the “smarts” to it. Visio 2010 Premium now contains a set of SharePoint workflow templates that can be used to create visualizations of workflows. In addition, three sets of SharePoint-related shapes are available, which you can drag onto the design surface to create workflows. Once created, the workflow visualization can be exported from Visio and opened for more work within SharePoint Designer 2010.
In this exercise, you will create a new Visio Graphics Service, configure the service, and view a visual workflow status page in the browser.
Lesson Requirements
To complete this Try It exercise, you need the following:
- Access to SharePoint Central Administration to create the Visio Graphic Application
- Access to a SharePoint site collection
- Microsoft Visio Premium 2010
Step-by-Step
From within SharePoint Central Administration you are going to create a new Visio Graphics Service. To continue do the following:
1. In the Application Management category, click Manage Service Applications.
2. Click New.
3. Select Visio Graphics Service.
4. Enter Visio Graphics Service Lesson 28 in the Visio Graphics Service Application Name text box.
5. Enter VisioAppPool in the Application Pool text box Create a New Application Pool.
6. Select the account to be used for the Application Pool.
7. Click OK to create the service.
8. In the Manage the Visio Graphics Service page, click Global Settings.
The global settings enable you to configure the Visio Graphics Service to your own specific business and system requirements, and for the purposes of this example, you can accept the available default settings. In the real world, the Visio Service global settings are specific to your environment and infrastructure. The same is true for the trusted data providers. The more common providers are already listed, and additions to this list will depend on the systems you need to access within your own environment. The default settings are as follows:
- Maximum Web Drawing Size: 5 MB.
- Minimum Cache Age: 5 minutes.
- Maximum Cache Age: 60 minutes.
- Maximum Recalc Duration: 60 seconds.
- External Data: This value is blank by default, but you must set it to access external data.
After the service has been configured, Visio web drawings can be rendered in the browser from SharePoint 2010. To continue with the exercise, start Microsoft Visio Premium or Professional 2010. Then, follow these steps to render the drawings:
1. Click File in the Visio menu.
2. Click the Sample Diagrams icon at the bottom of the screen.
3. Select the Project Management diagram.
4. Click Open to open the diagram in Visio.
5. Click File.
6. Click Save and Send.
7. Click Save to SharePoint.
8. Select your SharePoint site from the Available Sites listing.
9. Enter Project Management as the filename.
10. Select Web Drawing from the Save as Type drop-down.
11. Click Save.
Your diagram opens in the SharePoint document library in the web browser. Figure 28.4 shows the controls available in the browser view of the Visio drawing.
- Open in Visio link, which enables you to open the drawing for edit directly in Microsoft Visio 2010.
- Refresh Data Sources link. This enables you refresh the data used by Visio diagrams connected to external data stores for example Excel or SQL Server.
- Drop-down list to choose the page for viewing in multipage documents.
- Slider to increase and decrease the scale of documents in the browser.
- Zoom tool which allows you to quickly zoom the page to fit the available screen resolution.
- Icon to open data shapes data details which can enable you to view the data points associated with a particular Visio Shape if they are available. For example, a sales image may have underlying data associated with it, and clicking this icon displays the underlying data.

Please select Lesson 28 on the DVD or visit www.wrox.com/go/sp2010-24 to view the video that accompanies this lesson.