In addition to letting you export data to dynamic Excel worksheets, Microsoft Dynamics CRM lets you export data to Excel PivotTables. Excel PivotTables give you the ability to cross-tabulate data to produce summarized reports.
Some people initially struggle with the concept of PivotTables. Consider the following example, in which you have this table of activities:
Owner | Due Date | |
|---|---|---|
Phone Call | Mike Snyder | 8/15/2008 |
Task | Jim Steger | 8/15/2008 |
Appointment | Jim Steger | 8/12/2008 |
Phone Call | Kara O’Brien | 8/19/2008 |
Phone Call | Jim Steger | 9/1/2008 |
Task | Kara O’Brien | 9/5/2008 |
Mike Snyder | 9/5/2008 | |
Appointment | Kara O’Brien | 9/7/2008 |
Task | Kara O’Brien | 9/7/2008 |
Phone Call | Jim Steger | 9/7/2008 |
This table consists of flat data in columns and rows. Flat data generally serves as the basis for a PivotTable. With a data set of this size, you can easily count the records to summarize the data in a variety of ways. For example:
Four of the activities are phone calls.
Mike Snyder is the owner of two activities.
Three activities have a due date of 9/7/2008.
However, as your data set grows, summarizing the data at a glance becomes impossible. With a PivotTable, you can eliminate the manual calculation and pivot the data to get the answers. The following table is an example of a PivotTable on the flat data sample.
Jim Steger | Kara O’Brien | Mike Snyder | Grand Total | |
|---|---|---|---|---|
Appointment | 1 | 1 | 2 | |
1 | 1 | |||
Phone Call | 2 | 1 | 1 | 4 |
Task | 1 | 2 | 3 | |
Grand Total | 4 | 4 | 2 | 10 |
With the PivotTable, you can understand how many activities exist for each owner by type and in total. It also becomes clear how many total activities exist by type. You could have pivoted the data by due date rather than owner or activity type to see aggregates by due date.
Important
This chapter is not intended to teach you the full capabilities of PivotTables; it is meant to provide insight into basic PivotTable capability as it relates to your Microsoft Dynamics CRM data. For more information about PivotTables, see Microsoft Office Excel 2007 Step by Step, by Curtis D. Frye (Microsoft Press, 2007).
Although the concept of PivotTables might be intimidating at first, when you have obtained a comfort level with the process, you will be able to create powerful reports very efficiently. Similar to a dynamic worksheet, a dynamic PivotTable establishes a live link with your Microsoft Dynamics CRM database. Report setup is a one-time investment that you can benefit from continually. And learning how to use Excel PivotTables can help you solve reporting needs from other business-critical applications as well.
In this exercise, you will export data to a dynamic PivotTable to organize and summarize your Microsoft Dynamics CRM data.
Note
USE your own Microsoft Dynamics CRM installation in place of the Adventure Works Cycle site shown in this exercise.
BE SURE TO use the Internet Explorer Web browser to navigate to your Microsoft Dynamics CRM Web site, if necessary, before beginning this exercise.
In the Workplace area, click Activities.
The default activities view, My Activities, appears.
Click the Export to Excel button.
The Export Data To Excel dialog box opens.
Select Dynamic PivotTable.
Notice that the Select Columns button is enabled.
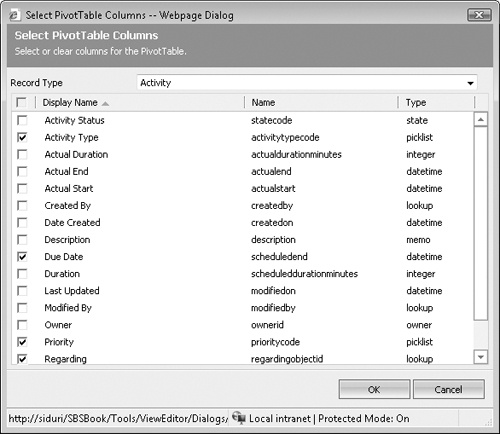
Click the Select Columns button.
The Select PivotTable Columns dialog box opens. The columns that appear in the My Activities grid are selected by default.
Select the check box for the Activity Status field, and then click OK.
This selection will make the Activity Status field available in the PivotTable.
Back in the Export Data to Excel dialog box, click Export.
The File Download dialog box opens.
Click Open.
This opens Excel with an empty PivotTable.
In the PivotTable field list on the right side of the screen, drag the Due Date field to the Row Labels section. Then drag the Due Date field to the Values section.
The PivotTable now shows a count of activities by due date.
Tip
While you are counting records, you can summarize numeric information in a variety of ways by changing the calculation type. To change the calculation type, click the arrow next to the field in the Values section, and click Value Field Settings. For example, you can modify the settings to summarize the data by Sum or Average.
Drag Due Date from the Row Labels section to the Column Labels section.
The same data is now pivoted in the opposite direction.
Drag the Regarding field into the Row Labels section.
The count of activities by due date for each Regarding option is now displayed.
Drag the Priority field into the Report Filter section.


Priority now appears at the top of the PivotTable as a parameter. When you make a selection in the Priority field, the PivotTable results will refresh for records with the selected priority.

You can continue to add fields into the PivotTable report to refine your analysis.
Advanced PivotTables
With dynamic PivotTables, you can create countless summary-level reports with just a few clicks. To further illustrate the capabilities, here are two examples of dynamic PivotTables created from Microsoft Dynamics CRM data.
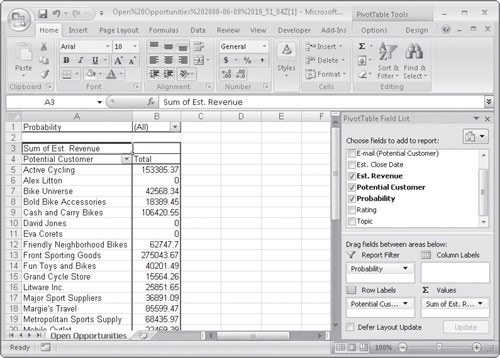
Example 1: Revenue by customer, filtered on closing probability

Example 2: Breakdown of customer accounts by city