
In this recipe, we will learn how to make intuitive heat maps in a calendar format to summarize time series data.
In this recipe, we will use a custom function called calendarHeat()
written by Paul Bleicher (released as open source under the GPL license). So let's first load the source code of the function (available from the downloads area of the book's website):
source("calendarHeat.R")We are going to use the google.csv example dataset, which contains stock price data for Google (ticker GOOG). Let's load it:
stock.data <- read.csv("google.csv")
calendarHeat() also make use of the chron library, which has to be installed and loaded using the following:
install.packages("chron")
library("chron")Let's visualize the adjusted closing price of the Google stock in a calendar heat map:
calendarHeat(dates=stock.data$Date,
values=stock.data$Adj.Close,
varname="Google Adjusted Close")
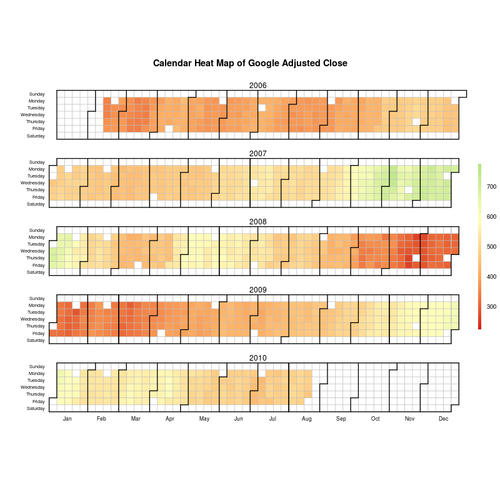
We used the calendarHeat() function, which uses the grid, lattice, and chron libraries, to make the heat map. The main arguments are dates and values, which we set to the Date and Adj.Close columns of our dataset respectively. We also used the varname argument to set the title of the heat map.
There are several other arguments which can be passed to calendarHeat(). For example, we can specify the format our input dates are in using the date.form argument. The default format is YYYY-MM-DD, which matches our original dataset. However, if the dates were in another format, say MM-DD-YY, we could set date.form to "%m-%d-%y".
The number of colors in the color scale are controlled by the ncolors argument, which has a default value of 99. The color scheme is specified by the color argument, which takes some predefined palette names as values. The default is r2g (red to green), and other options are r2b (red to blue) and w2b (white to blue). We can add more options simply by adding a definition for a new color palette as a vector of colors.
Another useful package which provides a calendar heat map functionality is the openair package, which has been primarily created for air pollution data analysis. Let's make a pollution heat map using this package.
First, we need to install and load it:
install.packages("openair")
library(openair)
To make our first air pollution calendar heat map, we can simply run:
calendarPlot(mydata)
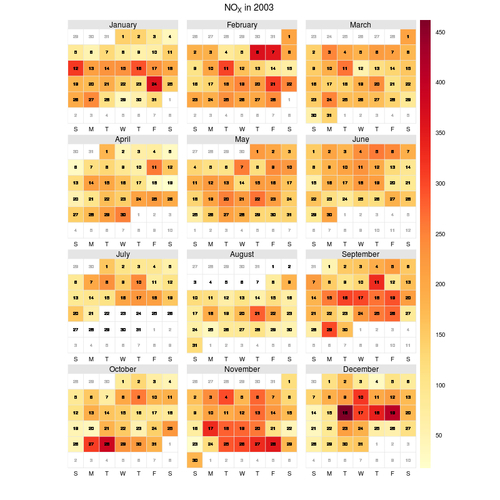
The graph shows some Nitrogen Oxides (NOx) concentration data from London in 2003 in the form of a heat map overlaid on a regular calendar.
We only had to pass one argument mydata to the calendar.plot() function, which uses the package's default mydata dataset. Run head(mydata) at the R prompt to see what the data looks like and all the columns in the dataset. The first column contains GMT date and time values in a long format (YYYY-MM-DD HH:MM:SS). If we want to use the calendar.plot() function, as it is for visualizing other types of temporal data, we can do so as long as the date column is in the same format and we specify the variable to be plotted using the pollutant argument. The default value of pollutant is "nox", which is the name of the column that contains the NOx values.
Let's say, we want to plot daily sales data instead. Let's use the rnorm() function to create some fake data and add it as a column to the mydata dataset:
mydata$sales<-rnorm(length(mydata$nox),mean=1000,sd=1500)
The code added a sales column to mydata, with random values following a normal distribution with a mean of 1000 and standard deviation of 1500. Now, let's use calendar.plot() to make a heat map for this sales data.
calendarPlot(mydata,pollutant="sales",main="Daily Sales in 2003")

In the example, we set the pollutant argument to the newly created sales column (note that we have to pass it as a string in quotes). We also set the plot title using the main argument. The calendar.plot() function uses the lattice library to generate the heat maps. Please see the help file (?calendar.plot) to see other arguments you can use.