Sometimes, we may wish to change the definition of outliers in our dataset by changing the extent of the whiskers. In this recipe, we will learn how to adjust the extent of whiskers in a box plot by passing a simple argument.
We will continue using the base graphics library functions, so we need not load any additional library or package. We just need to run the recipe code at the R prompt. We can also save the code as a script to use it later. Here, we will use the metals.csv example dataset again:
metals<-read.csv("metals.csv")Let's draw the metal concentrations box plot with the whiskers closer to the box than the default one in the last recipe:
boxplot(metals[,-1],
range=1,border = "white",col = "black",
boxwex = 0.3,medlwd=1,whiskcol="black",
staplecol="black",outcol="red",cex=0.3,outpch=19,
main="Summary of metal concentrations by Site

(range=1) ")

We passed the range argument with a value of 1 to the boxplot() function in order to reduce the extent of the whiskers. The default value of range is 1.5—it only takes positive values. The whiskers extend to the most extreme data point which is no more than range times the interquartile range from the box.
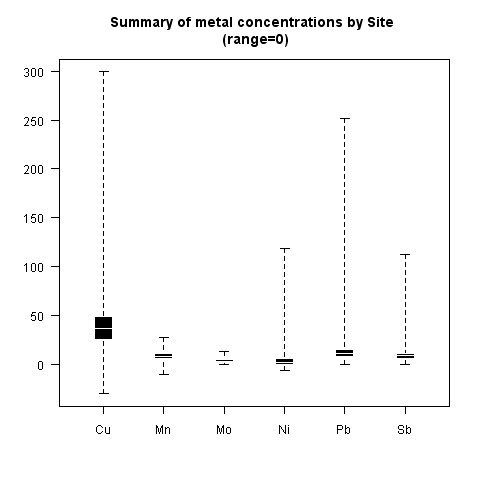
If we want to extend the whiskers to the data extremes, we can either set range to a high enough value, such that range times the interquartile range from the box is more than the most extreme data point. Alternatively, we can simply set range to zero:
boxplot(metals[,-1],
range=0,border = "white",col = "black",
boxwex = 0.3,medlwd=1,whiskcol="black",
staplecol="black",outcol="red",cex=0.3,outpch=19,
main="Summary of metal concentrations by Site
 (range=0)")