
In this recipe, we will learn how to plot data on top of Google map images using a special package that connects to Google's Static Maps API.
First we need to install the RgoogleMaps package and a related package rgdal:
install.packages("rgdal")
library(rgdal)

install.packages("RgoogleMaps")
library(RgoogleMaps)
We will use the londonair.csv example dataset for this recipe. This dataset contains annual average concentrations of particulate matter in London's atmosphere measured at 12 different air quality monitoring sites across the city (data source: London air website http://www.londonair.org.uk). So let's load that too:
air<-read.csv("londonair.csv")Let's pull a Google map of London city and plot the pollution data as points on top of it:
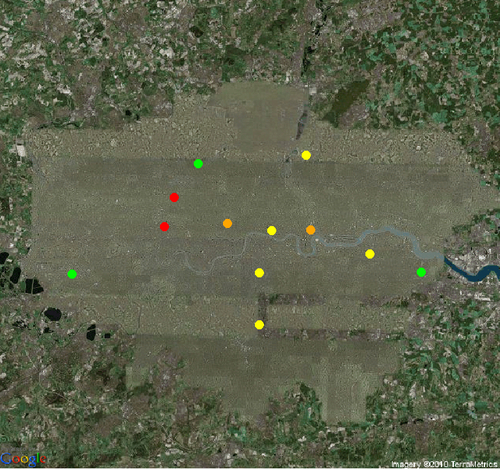
london<-GetMap(center=c(51.51,-0.116),
zoom =10, destfile = "London.png",maptype = "mobile")

PlotOnStaticMap(london,lat = air$lat, lon = air$lon,
cex=2,pch=19,col=as.character(air$color))

Now let's make the same graph with a satellite image map instead of the roadmap:
london<-GetMap(center=c(51.51,-0.116),zoom =13,
destfile = "London_satellite.png",maptype = "satellite")

PlotOnStaticMap(london,lat = air$lat, lon = air$lon,
cex=2,pch=19,col=as.character(air$color))
In the examples, we first used the GetMap() function from the RgoogleMaps package to pull a map of London from the Google Static Maps API (see http://code.google.com/apis/maps/documentation/staticmaps/ for more details about the API). We then used the
PlotOnStaticMap() function to overlay our air pollution data points on the map.
The first and most important argument to the GetMap() function is the center argument, which takes a vector of two values specifying the latitude and longitude of the location to be used as the center of the map. The zoom level is specified by the zoom argument, which has a default value of 12. The higher the value of zoom, the more detailed and zoomed in the view. In the example, we set zoom to 10 so as to capture a wide area of London.
We also specified the
destfile argument to save the retrieved map as London.png. The default value of destfile is MyTile.png. You can check whether the map is retrieved by looking for the PNG file in your working folder.
Finally, we also set the maptype argument, which can take one of a number of different values such as "roadmap", "mobile", "satellite", "terrain", "hybrid", "mapmaker-roadmap", and "mapmaker-hybrid". The default map type is terrain. We set maptype to mobile in the first example and satellite in the second example.
If you look at the output of the GetMap() function call at the R prompt you will notice that it shows a URL such as:
[1] http://maps.google.com/staticmap?center=51.51,-0.116&zoom=10&size=640x640&maptype=mobile&format=png32&key=&sensor=true
Basically, the GetMap() function creates an HTTP GET request URL with parameters based on the arguments supplied. To test this, copy the provided URL and paste it into the address bar of a web browser. You should get the image of the specified map.
We saved the object returned by the GetMap() function call as london, which we then passed as the first argument to the
PlotOnStaticMap() function. As the name suggests, this function plots data on top of map objects. The air pollution dataset londonair.csv that we loaded earlier contains monitoring site data including site code, name, latitude, longitude, particle concentration (PM10), and a color based on the concentration value. We passed these values to the PlotOnStaticMap() function. We set the lat and lon arguments to the lat and lon columns in the air data frame respectively. We set the col argument to the color column in air.
We can overlay more data points or lines successively on top of a map by setting an additional argument add to TRUE. By default, add is set to FALSE which creates a new map with the specified data points or lines. To draw lines instead of points, we need to set the FUN (meaning function) argument to lines. By default, FUN is set to points.
The following is another example pulling in a hybrid map of New York:
GetMap(center=c(40.714728,-73.99867), zoom =14,
destfile = "Manhattan.png", maptype = "hybrid");
Another maps library, which is becoming increasingly popular, is Open Street Map (http://www.openstreetmap.org/). It's a free and open source editable library, unlike Google's proprietary maps API. The following is an example based on the GetMap.OSM() function which uses the Open Street Map server:
GetMap.OSM(lonR= c(-74.67102, -74.63943),
latR = c(40.33804,40.3556),scale = 7500,
destfile = "PrincetonOSM.png")
GetMap.OSM() takes the ranges of longitude and latitude as two two-valued vectors lonR and latR respectively. The scale argument is analogous to the zoom argument for the Google API. The larger this value, the more detailed the resulting map.