
Sometimes we may wish to label bars by placing text inside the bars instead of using a legend. In this recipe, we will learn how to do that based on code similar to the previous recipe.
We will use the cityrain.csv example dataset. We don't need to load any additional packages for this recipe.
We will plot the rainfall in the month of January in four cities as a horizontal bar chart:
rain<-read.csv("cityrain.csv")

y<-barplot(as.matrix(rain[1,-1]),horiz=T,col="white",
yaxt="n",main=" Rainfall in January",xlab="Rainfall (mm)")

x<-0.5*rain[1,-1]
text(x,y,colnames(rain[-1]))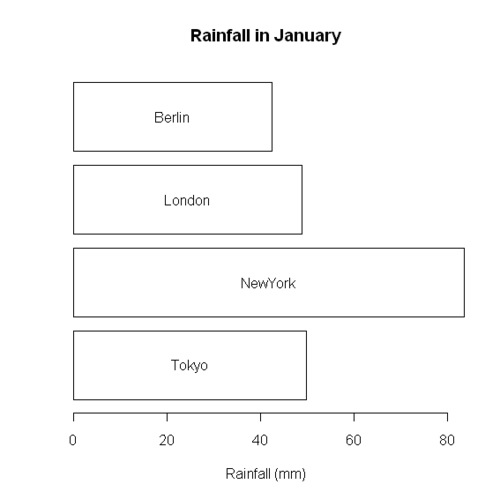
The example is very similar to the one in the previous recipe. The only difference is that now we are plotting one set of bars, not groups of bars. Because we want to place the labels inside the bars, we turned off the Y axis labels by setting yaxt="n". Otherwise, the city names would appear along the Y axis to the left of the bars. We retrieve the Y axis co-ordinates of the bars by setting y to the barplot function call. We created the vector x so as to place the labels in the middle of each of the bars by multiplying the rainfall values by 0.5. Note that these X co-ordinates represent the center of each label, not its start. Finally, we pass the x and y co-ordinates and city names to text() to label the bars.