
In this recipe, we will learn how to plot formatted date or time values on the X axis.
We will use the dailysales.csv example dataset to plot the number of units of a product sold daily in a month:
sales<-read.csv("dailysales.csv")
plot(sales$units~as.Date(sales$date,"%d/%m/%y"),type="l",
xlab="Date",ylab="Units Sold")
Once we have formatted the series of dates using as.Date(), we can simply pass it to the plot() function as the x variable in either the plot(x,y) or plot(y~x) format.
We can also use strptime() instead of using as.Date(). However, we cannot pass the object returned by strptime() to plot() in the plot(y~x) format. We must use the plot(x,y) format as follows:
plot(strptime(sales$date,"%d/%m/%Y"),sales$units,type="l",
xlab="Date",ylab="Units Sold")
We can plot the example using the zoo() function as follows (assuming zoo is already installed):
library(zoo)
plot(zoo(sales$units,as.Date(sales$date,"%d/%m/%y")))
Note that we don't need to specify x and y separately when plotting using zoo; we can just pass the object returned by zoo() to plot(). We also need not specify the type as "l".
Let's look at another example which has full date and time values on the X axis, instead of just dates. We will use the openair.csv example dataset for this example:
air<-read.csv("openair.csv")

plot(air$nox~as.Date(air$date,"%d/%m/%Y %H:%M"),type="l",
xlab="Time", ylab="Concentration (ppb)",
main="Time trend of Oxides of Nitrogen")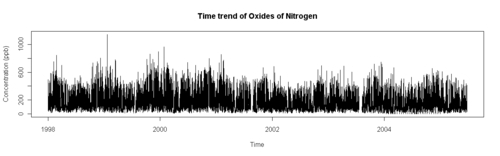
The same graph can be made using zoo as follows:
plot(zoo(air$nox,as.Date(air$date,"%d/%m/%Y %H:%M")),
xlab="Time", ylab="Concentration (ppb)",
main="Time trend of Oxides of Nitrogen")