
The default axis settings are often not adequate to deal with all kinds of data. For example, we may wish to change the number of tick marks along an axis or change the orientation of the annotations if they are too long to fit horizontally. In this recipe we will cover some settings which can be used to customize axes as per our requirements.
All you need to try out this recipe is to run R and type the recipe at the command prompt. You can also choose to save the recipe as a script so that you can use it again later on.
We can set the xaxp and yaxp arguments with the par() command to specify co-ordinates of the extreme tick marks and the number of intervals between tick marks in the form c(min,max,n).
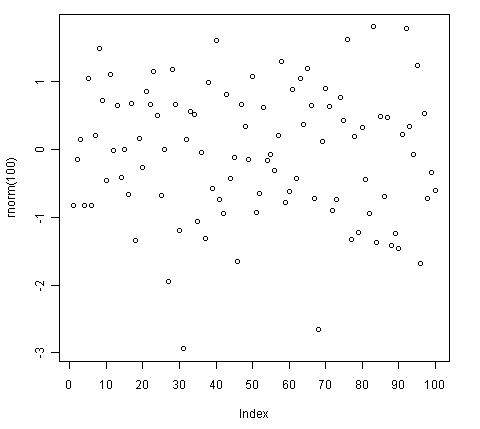
plot(rnorm(100),xaxp=c(0,100,10))
When xaxp or yaxp is not specified, R automatically calculates the number of tick marks and their values. By default, R extends the axis limits by adding 4% at each end and then draws an axis which fits within the extended range. This means that even if we set the axis limits using xlim or ylim, the graph corners don't exactly correspond with those values. To make sure they do, we need to change the axis style using the xaxs argument, which takes one of two possible values: r (regular or default) and i (internal). We need to set xaxs to i.
A vector of the form c(x1, x2, n) giving the co-ordinates of the extreme tick marks and the number of intervals between tick marks
To change the orientation of axis value annotations, we need to set the las argument of the par() command. It takes one of four possible numeric values:
- 0: always parallel to the axis (default)
- 1: always horizontal
- 2: always perpendicular to the axis
- 3: always vertical
We can also use the axis() command to make a custom axis by specifying a number of arguments. The basic arguments are:
sidewhich takes numeric values (1=below, 2=left, 3=above and 4=right)atwhich takes a vector of co-ordinates where tick marks are to be drawnlabelswhich takes a vector of tick mark annotations
We can separately set the line width for the axis lines and the tick marks by passing the lwd and lwd.ticks arguments respectively. Similarly colors can be set using the col and col.ticks arguments.