
In this recipe, we will learn how to create a correlation matrix, which is a handy way of quickly finding out which variables in a dataset are correlated with each other.
To try out this recipe, simply type it at the command prompt. You can also choose to save the recipe as a script so that you can use it again later on.
We will use the iris flowers dataset that we first used in the pairs plot recipe in Chapter 1:
panel.cor <- function(x, y, ...)
{
    par(usr = c(0, 1, 0, 1))
    txt <- as.character(format(cor(x, y), digits=2))
    text(0.5, 0.5, txt,  cex = 6* abs(cor(x, y)))
}

pairs(iris[1:4], upper.panel=panel.cor)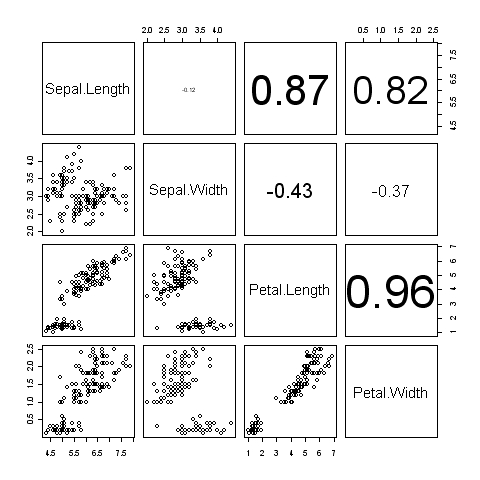
We have basically used the
pairs() function to make the graph, but in addition to the dataset we also set the upper.panel argument to panel.cor, which is a function we define beforehand. The upper.panel argument refers to the squares in the top-right half of the previous graph the diagonal going from the top-left to the bottom-right. Correspondingly, there is also a lower.panel argument for the bottom-left half of the graph.
The panel.cor value is defined as a function using the following notation:
newfunction<-function(arg1, arg2, ...)
{
#function code here
}
The
panel.cor function does a few different things. First it sets the individual panel block axes limits to c(0,1,0,1) using the par() command. Then it calculates the correlation co-efficient value between a pair of variables up to two decimal values and formats it as a text string so that it can then be passed to the text() function which places it in the center of each block. Also note that the size of the labels is set using the cex argument to a multiple of the absolute value of the correlation co-efficient. Thus the size of the value label also indicates how important the correlation is.
Panel functions are in fact one of the most powerful features of the lattice package. To learn more about them and the package, please refer to the excellent book "Lattice: Multivariate Data Visualization with R" by Deepayan Sarkar, who is also the author of the package. The book website is at: http://lmdvr.r-forge.r-project.org/figures/figures.html