
Sometimes we may wish to use a legend to annotate a pie chart instead of using labels. In this recipe we will learn how to do that using the
legend() function.
Once again in this recipe, we will use the browsers.txt example dataset, which contains data about the usage percentage share of different internet browsers.
First we will load the browsers.txt dataset and then use the pie() function to draw a pie chart:
browsers<-read.table("browsers.txt",header=TRUE)
browsers<-browsers[order(browsers[,2]),]

pielabels <- sprintf("%s = %3.1f%s", browsers[,1],
100*browsers[,2]/sum(browsers[,2]), "%")

pie(browsers[,2],
labels=NA,
clockwise=TRUE,
col=brewer.pal(7,"Set1"),
border="white",
radius=0.7,
cex=0.8,
main="Percentage Share of Internet Browser usage")


legend("bottomright",legend=pielabels,bty="n",
fill=brewer.pal(7,"Set1"))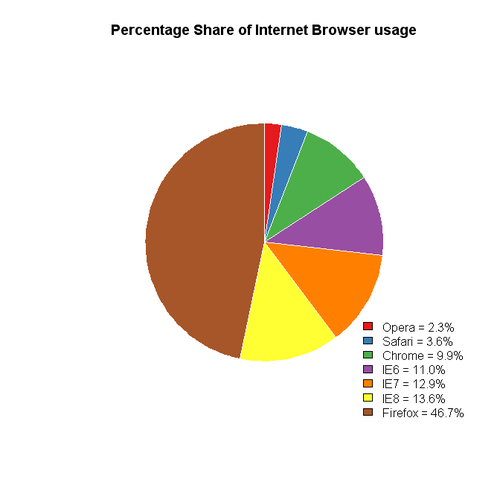
Once again we ordered the browser dataset, created a vector of labels and made the pie chart with the pie() function call, just like in the previous recipe. However, we set labels to NA this time as we want to create a legend instead of labeling the slices directly.
We added a legend to the bottom-right corner by calling the legend() function. We passed the pielabels vector as the legend argument and set the fill argument to the same RColorBrewer color palette we used for the pie slices.