
In most scientific data visualization, error bars are necessary to show the level of confidence in the data. However, there is no pre-defined function in the base R library for drawing error bars. In this recipe we will learn how to draw error bars in scatterplots.
All you need for the next recipe is to type it at the R prompt as we will use some base library functions to define a new error bar function. You may also save the recipe code as a script so that you can use it again later on.
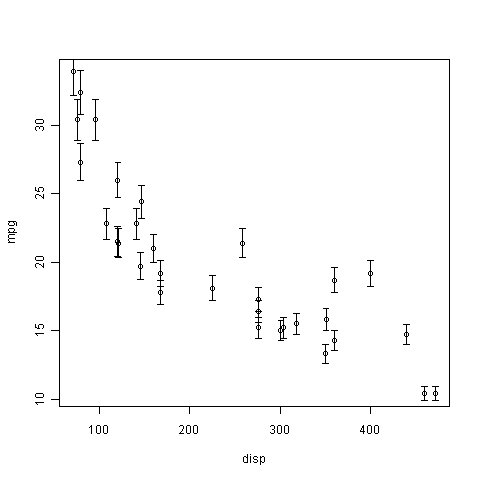
Let's draw vertical error bars with 5% errors on our cars scatterplot using the arrows() function:
plot(mpg~disp,data=mtcars)

arrows(x0=mtcars$disp,
y0=mtcars$mpg*0.95,
x1=mtcars$disp,
y1=mtcars$mpg*1.05,
angle=90,
code=3,
length=0.04,
lwd=0.4)
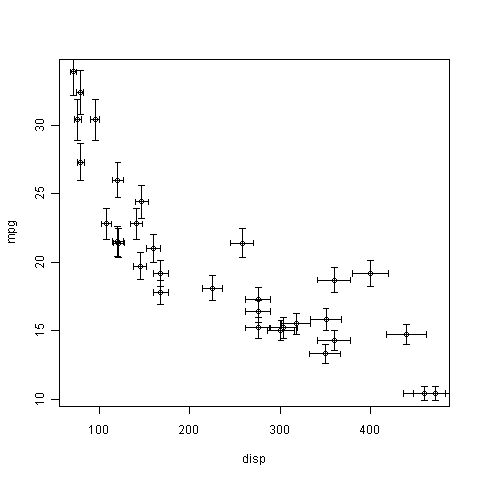
To add horizontal error bars (also 5% in both directions) to the same graph, run the following code after making the earlier graph:
arrows(x0=mtcars$disp*0.95,
y0=mtcars$mpg,
x1=mtcars$disp*1.05,
y1=mtcars$mpg,
angle=90,
code=3,
length=0.04,
lwd=0.4)
In the previous two examples we used the arrows() function to draw horizontal and vertical error bars. arrows() is a base graphics function for drawing different kinds of arrows. It provides various arguments to adjust the size, location, and shape of the arrows such that they can be used as error bars.
The first four arguments define the location of the start and end points of the arrows. The first two arguments x0 and y0 are co-ordinates of the starting points and the next two arguments x1 and y1 are co-ordinates of the end points of the arrows.
For drawing vertical error bars, say with a 5% error both ways, we set both x0 and x1 to the x location of the data points (in this case mtcars$disp) and we set y0 and y1 to the y values of the data points plus and minus the error margin (1.05*mtcars$mpg and 0.95*mtcars$mpg respectively).
Similarly, for drawing horizontal error bars we have the same y co-ordinate for the start and end, but add and subtract the error margin from the x co-ordinates of the data points.
The angle argument is for setting the angle between the shaft of the arrow and the edge of the arrowhead. The default value is 30 (which looks more like an arrow), but to use as an error bar we set it to 90 (to flatten out the arrowhead in a way).
The code argument sets the type of arrow to be drawn. Setting it to 3 means drawing an arrowhead at both ends.
The length and lwd arguments set the length of the arrowheads and the line width of the arrow respectively.
The Hmisc package has the errbar function, which can be used to draw vertical error bars. The
plotrix package has the plotCI function which can be used to draw error bars or confidence intervals. If we do not wish to write our own error bars function using arrows(), it's easier to use one of these packages.