
Line graphs are generally used for looking at trends in data over time, so the X variable is usually time expressed as time of the day, date, month, year, and so on. In this recipe, we will see how we can quickly plot such data using the same plot() function, which was used in the previous recipe to make scatter plots.
First we need to load the dailysales.csv example data file. You can download this file from the code download section of the book's companion website:
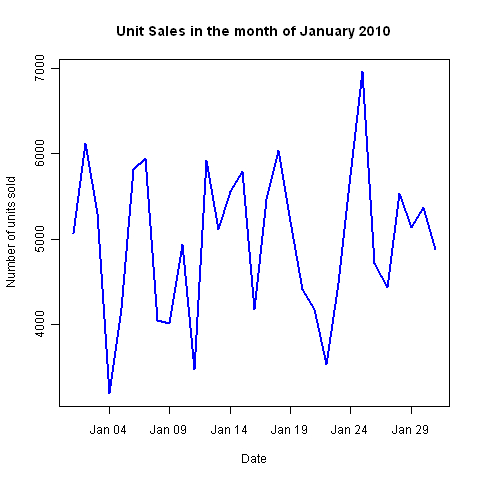
sales<-read.csv("dailysales.csv", header=TRUE)As the file name suggests, it contains daily sales data of a product. It has two columns: a date column and a sales column showing the number of units sold.
Here's the code to make your first line graph:
plot(sales$units~as.Date(sales$date,"%d/%m/%y"),
type="l", #Specify type of plot as l for line
main="Unit Sales in the month of January 2010",
xlab="Date",
ylab="Number of units sold",
col="blue")
We first read the data file using the read.csv() function. We passed two arguments to the function: the name of the file we want to read (dailysales.csv in double quotes) and with header=TRUE we specified that the first row contains column headings. We read the contents of the file and saved it in an object called sales with the left arrow notation.
You must have noticed that the plotting code is quite similar to that for producing a scatter plot. The main difference is that this time we passed the
type argument. The type argument tells the plot() function whether you want to plot points, lines, or other symbols. It can take nine different values.
Note
Please see the help section on plot() for more details. The default value of type is "p" as in points.
If the type is not specified R assumes you want to plot points as it did in the scatter plot example.
The most important part of the example is the way we read the date using the as.Date() function. Reading dates in R is a bit tricky. R doesn't automatically recognize date formats. The as.Date() function takes two arguments: the first is the variable which contains the date values and the second is the format the date values are stored in. In the example, the dates are in the form date/month/year or dd/mm/yyyy, which we specified as %d/%m/%y in the function call. If the date was in mm/dd/yyyy format, we'd use %m/%d/%y.
The plot and axes titles and line color are set using the same arguments as for the scatter plot.
If you want to plot another line on the same graph, say daily sales data of a second product, you can use the lines() function:
lines(sales$units2~as.Date(sales$date,"%d/%m/%y"),
col`="red")
Line graphs and time series charts are covered in depth in Chapter 4, Creating Line Graphs and Time Series Plots.