
Important Performance Monitor Counters
The Windows Operating System and Lync Server 2013 enable administrators to monitor a very large number of counters in Performance Monitor. This section outlines key Performance Monitor counters for a performance baseline with Lync Server 2013. It is recommended to explore the Performance Monitor counters available on your servers to become familiar with the tools you will have available in any troubleshooting situation.
To explore the Performance Monitor counters available for Lync Server 2013, do the following:
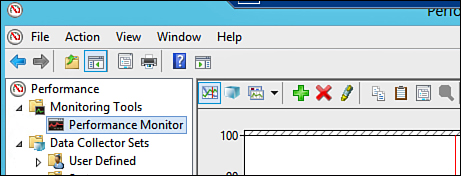
1. Open the Performance Monitor tool, located in the Administrative Tools on a Windows Server.
2. Select Performance Monitor, and then click the green plus sign to add a new counter. See Figure 13.1 for an example.
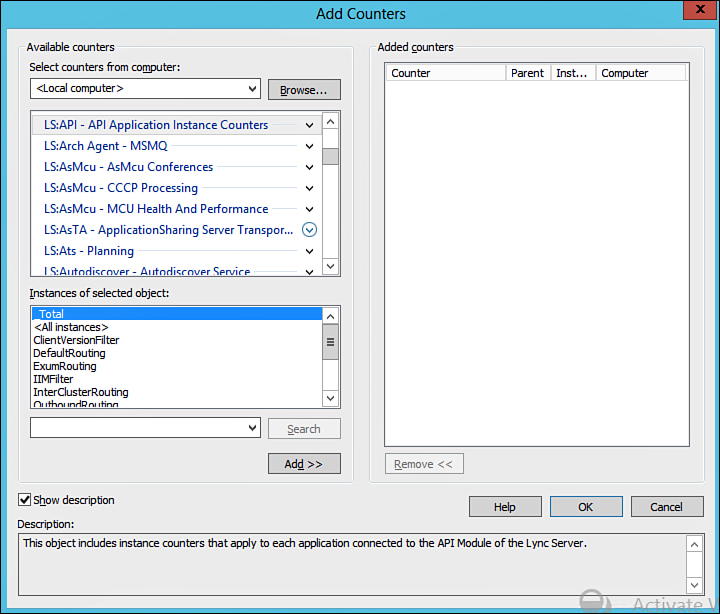
3. All Lync Server 2013 counters will start with “LS:”; check the box for Show Description and each counter will display a description to help with identifying the counters. Figure 13.2 shows an example of the initial set of LS counters in Performance Monitor.
After you’ve explored the available performance counters for Lync Server 2013, it should be evident that there are many different aspects of Lync Server 2013 available for monitoring. However, establishing a performance baseline on your servers should involve only a few key counters. Use the sections that follow as a guide for counters to choose when establishing a performance baseline.
CPU
Lync Server 2013 media processing can apply a large CPU load on any server. Depending on how the Lync deployment was designed, servers can have varying CPU utilization. Use the following counter to ensure that CPU usage is not too great on your Lync Servers.
Processor\% Processor Time: This counter is the percentage of time elapsed that the processor spends to execute a non-idle thread. This is the primary indicator of processor activity, and it displays the average percentage of busy time observed during the sample interval. If this value is above 80% consistently, a machine might be overutilized.
Memory
Lync Server services are heavy in memory utilization, especially conferencing servers. Use the following counters to ensure that memory utilization is not too high on your Lync Servers.
MemoryAvailable Mbytes: This counter simply keeps track of the available memory to the system. When this value is low, it is a sign of memory utilization being too high. This will also help with understanding the scaling impact that additional features and users have on your Lync Server systems.
MemoryPages/sec: Pages/sec is the rate at which pages are read from or written to disk to resolve hard page faults. This counter is a primary indicator of the kinds of faults that cause systemwide delays. It is the sum of MemoryPages Input/sec and MemoryPages Output/sec. It is counted in numbers of pages, so it can be compared to other counts of pages, such as MemoryPage Faults/sec, without conversion. It includes pages that are retrieved to satisfy faults in the file-system cache and that are usually requested by applications using mapped memory files. A high rate for the Pages/sec counter could indicate excessive paging. Monitor the MemoryPage Faults/sec counter to make sure that the disk activity is not caused by paging.
Disk
Lync Server 2013 performs a large amount of disk activity on the Front End and Back End servers. Front End servers maintain presence and other dynamic data in the local SQL database, and Back End servers are responsible for all Lync user information, conference information, and configuration information. Disk performance is critical on all Lync Servers. Use the following counters to keep track of disk performance.
Physical DiskCurrent Disk Queue Length (select All Instances): Current Disk Queue length represents the number of requests outstanding on the disk at the time data is collected. If a disk is overloaded, it is likely that this value will be consistently high. Requests experience delays proportional to the length of this queue, minus the number of spindles on the disks. For good performance, the difference should average less than 2.
Network
Modern hardware does not often allow for overutilizing server network interface cards (NICs). However, it is important to understand the amount of traffic your servers are sending and receiving for baseline performance. In some instances, this network traffic might increase without notice, and it might help identify issues.
Network InterfaceBytes Total/sec: Bytes Total/sec is the rate at which bytes are sent and received over each network adapter, including framing characters. Network InterfaceBytes Total/sec is a sum of Network InterfaceBytes Received/sec and Network InterfaceBytes Sent/sec. This counter should be lower than the maximum bandwidth that the current network link provides.
Lync Server
Lync Server 2013 includes many counters that monitor the service activity, health, and performance. The following counters are important for baseline performance monitoring, as well as ongoing monitoring and troubleshooting.
LS:SIP - PeersTLS Connections Active: The number of established TLS connections that are currently active. A TLS connection is considered established when the peer certificate and the hostname are verified for a trust relationship. Having a baseline of this counter will allow administrators to identify problem areas in troubleshooting scenarios.
LS:SIP - PeersIncoming Requests/sec: This counter represents the per-second rate of received SIP requests. Having a baseline of this counter enables administrators to identify problem areas in troubleshooting scenarios.
LS:SIP - ResponsesLocal 503 Responses/sec: This counter represents the per-second rate of 503 SIP responses that are generated by the server. A SIP 503 response indicates a service failure.
LS:SIP - Load ManagementAverage Holding Time for Incoming Messages: This counter represents the average time that a server held incoming messages before processing. A healthy Lync Server system should have a holding time of less than 3 seconds.
LS:USrv - REGDBStoreQueue Depth: This counter represents the number of requests waiting to be run by the Lync Registrar Service. A healthy Lync Front End Server should show a queue depth of less than 500.
LS:USrv - REGDBStoreQueue Latency (msec): This counter represents the time a request spends in a Lync Server queue waiting to be serviced by the SQL Server Service. A healthy Lync Server and SQL Server connection should show a value of less than 5000 msec.
LS:USrv - REGDBStoreSProc Latency (msec): This counter represents the time it takes for the SQL Server Service to service requests from the Lync Server. This value should have an average of less than 80 msec during normal operations. A high value for this counter is a clear sign of SQL Server performance issues.
LS:USrv - DBStoreQueue Depth: This counter represents the number of requests waiting to be run by the Lync Server User Services to the SQL Server Service. A healthy Lync Front End Server should show a queue depth of less than 1000.
LS:USrv - DBStoreQueue Latency (msec): This counter represents the time a request spends in a Lync Server queue waiting to be serviced by the SQL Server Service. A healthy Lync Server and SQL Server connection should show a value of less than 5000 msec.
LS:USrv - DBStoreSProc Latency (msec): This counter represents the time it takes for the SQL Server Service to service requests from the Lync Server. This value should have an average of less than 80 msec during normal operations. A high value for this counter is a clear sign of SQL Server performance issues.
LS:USrv - Directory SearchSearch Latency (ms): This counter represents the average time it takes to perform LDAP searches. This counter can be used to identify delays in queries to Global Catalog servers in AD.
LS:USrv - Pool Conference StatisticsActive Conference Count: This counter represents the number of active conferences of all types in the Front End Server Pool. This can be used to show the true maximum concurrency of any Conferencing Pool. This can also be referenced when changes are made to the environment to see the effect those changes have had on usage.
LS:USrv - Pool Conference StatisticsActive Participant Count: This counter represents the number of active conferencing participants of all types in the Front End Server Pool. This can be used to show the true maximum user concurrency of any Conferencing Pool. This can also be referenced when changes are made to the environment to see the effect those changes have had on usage.
LS: MEDIA - OperationsGlobal Health: This counter represents the overall health of the different Lync Server Media components installed on a server. This can include the Application Sharing MCU (ASMCU), the A/V MCU (AVMCU), Call Park Service, Conferencing Announcement Service, Conferencing Attendant, Response Group Service, Reach Server (Web App), and the Mediation Server Service. Every media component provides a numeric health indicator, the values of which follow:
0 Disabled
1 Normal
2 Light Load
3 Heavy Load
4 Overload
LS:MEDIA - PlanningNumber of Conferences with NORMAL Health State: This counter represents the number of currently active conferences across all media components. It provides an overview of what media or conferences are currently active, and how many are in a healthy state. This can include the ASMCU, the AVMCU, Call Park Service, Conferencing Announcement Service, Conferencing Attendant, Response Group Service, Reach Server (Web App), and the Mediation Server Service.
LS:MEDIA - PlanningNumber of Conferences with OVERLOADED Health State: This counter represents the number of currently active conferences across all media components. It provides an overview of what media or conferences are currently in an unhealthy state. This can include the ASMCU, the AVMCU, Call Park Service, Conferencing Announcement Service, Conferencing Attendant, Response Group Service, Reach Server (Web App), and the Mediation Server Service.