 Collecting and Analyzing Performance Monitor Data
by Randy Wintle, Alex Lewis, David Ross, Tom Pacyk
Microsoft® Lync® Server 2013 Unleashed Second Edition
Collecting and Analyzing Performance Monitor Data
by Randy Wintle, Alex Lewis, David Ross, Tom Pacyk
Microsoft® Lync® Server 2013 Unleashed Second Edition
- Title Page
- Copyright Page
- Contents at a Glance
- Table of Contents
- Foreword
- About the Authors
- Dedications
- Acknowledgments
- We Want to Hear from You!
- Reader Services
- Introduction
- Part I: Lync Server 2013 Overview
- Chapter 1. Getting Started with Microsoft Lync Server 2013
- Chapter 2. What’s New in Microsoft Lync Server 2013
- Chapter 3. Feature Overview and Benefits of Microsoft Lync Server 2013
- Chapter 4. Business Cases for Lync Server 2013
- Why Unified Communications
- Instant Messaging and Presence
- Benefits of Instant Messaging and Presence
- Web, Audio, and Video Conferencing
- Benefits of Web, Audio, and Video Conferencing
- Enterprise Telephony
- Understanding the Benefits of Enterprise Telephony as part of a UC Solution
- Unified Messaging
- Understanding the Benefits of Unified Messaging as Part of a UC Solution
- Return on Investment (ROI)
- UC Investments
- Consider the Capital Investments
- Consider the Operating Expenses
- Consider the Committed or “Dual-Run” Costs
- Realizing ROI with Audio Conferencing
- Realizing ROI with Centralized Telephony
- Reduced Hardware Footprint
- Reduced Support Costs
- SIP Trunking Opportunity
- Realizing ROI with Productivity Increases
- Realizing ROI with Reduced Travel Costs
- Realizing ROI with Reduced Real Estate Costs
- Why Lync 2013 for Unified Communications
- Summary
- Why Unified Communications
- Part II: Microsoft Lync Server 2013 Server Roles
- Chapter 5. Microsoft Lync Server 2013 Front End Server
- Chapter 6. Microsoft Lync Server 2013 Edge Server
- Edge Server Overview
- Edge Server Installation
- Hardware Requirements
- Operation System Requirements
- Software Requirements
- Server Roles and Features
- Configure Networking
- IPv6 Support
- Create the Edge Pool
- Edit the Topology
- Deploying a Single Edge Server Pool
- Deploying a Load-Balanced Edge Server Pool
- Publish the Topology
- Installing the Edge Server
- Export Topology
- Installing a Local Configuration Store
- Installing the Lync Server Components
- Creating Certificates
- Importing Offline Certificate Requests
- Assigning Certificates
- Start Services
- Edge Server Configuration
- Edge Server Administration
- Edge Server Troubleshooting
- Firewall Ports
- Routing
- Certificates
- Edge Internal Certificate Names
- Access Edge Certificate Names
- Web Conferencing Edge Certificate Names
- A/V Authentication Certificate Names
- Wildcard Certificates
- DNS Records
- Windows Event Logs
- Lync Centralized Logging
- Lync Server Management Shell
- Telnet
- Troubleshooting Lync Services
- Edge Server Best Practices
- Summary
- Chapter 7. Microsoft Lync Server 2013 Monitoring and Archiving
- Chapter 8. Mediation Server
- Mediation Server Overview
- Installing Mediation Server
- Prerequisites
- Hardware Recommendations
- Operating System Requirements
- Software Requirements
- Server Roles and Features
- Create a Mediation Server Pool
- Steps to Edit the Existing Topology
- Steps to Publish the Updated Topology
- Install Lync Mediation Server Components
- Cache Installation Files
- Install Local Configuration Store
- Install Lync Server Components
- Create Certificates
- Assign Certificates
- Start Services
- Mediation Server Configuration
- Mediation Server Administration
- Mediation Server Troubleshooting
- Summary
- Best Practices
- Chapter 9. Director
- Director Overview
- Installing the Director Role
- Prerequisites
- Hardware Recommendations
- Operating System Requirements
- Software Requirements
- Server Roles and Features
- Installing Server Role Prerequisites
- Creating a Director Pool
- Edit Topology
- Publish Topology
- Install Server
- Cache Installation Files
- Install Local Configuration Store
- Install Lync Server Components
- Create and Install Certificates
- Assign Certificates
- Start Services
- Configuring the Director
- Administration of the Director Role
- Director Troubleshooting
- Summary
- Best Practices
- Chapter 10. Persistent Chat
- Part III: External Dependencies
- Chapter 11. Dependent Services and SQL
- Active Directory
- Domain Name System
- Server Certificates
- Network Dependencies
- Office Web Apps Server
- SQL Server Dependencies
- Lync Database Requirements
- Installing SQL Server for Lync
- SQL Backup Procedures
- Backing Up SQL Using Windows Server Native Backup
- Backing Up SQL Using SQL Server Management Studio
- Maintaining the Lync SQL Databases
- Checking and Repairing Database Integrity
- Monitoring and Reducing Fragmentation
- Shrinking Data Files
- Creating SQL Server Maintenance Plans
- Summary
- Chapter 12. Firewall and Security Requirements
- Firewall Requirements Overview
- Ports Required for Internal and External Access
- Using Network Address Translation (NAT) with Lync Server
- Reverse Proxy Requirements
- Reverse Proxy Configuration
- Create DNS Records for Lync Server Reverse Proxy
- Verifying Access to the Lync Web Services
- Configuring Microsoft Threat Management Gateway (TMG) for Lync Server
- Configure Web Farm FQDN
- Request and Configure SSL Certificates
- Configuring Web Publishing Rules
- Configuring Authentication and Certification on IIS Virtual Directories
- File Share Permissions
- Summary
- Chapter 11. Dependent Services and SQL
- Part IV: Administration and Management
- Chapter 13. Monitoring Lync Server 2013
- Understanding Key Areas to Monitor in Your Deployment
- Monitoring the Health and Performance of Lync Server 2013
- Using Performance Monitor to Establish Performance Baselines
- Important Performance Monitor Counters
- Collecting and Analyzing Performance Monitor Data
- Features Available in Lync Server 2013 for Health Monitoring and Troubleshooting
- Using Windows Event Logs to Identify Health Issues
- Using Synthetic Transactions to Identify Health Issues
- Capabilities and Benefits of System Center Operations Manager with Lync Server
- Monitoring the Health of Lync Server 2013 with SCOM
- Summary
- Chapter 14. Administration of Microsoft Lync Server 2013
- Administration Overview
- Lync Server Control Panel
- Lync Server Management Shell
- Benefits of the Management Shell
- Management Shell Basics
- Tips and Tricks
- Use the Tab Key
- Skip the Identity
- Surround Spaces with Quotation Marks
- Leverage Get-Help
- Role-Based Access Control
- Lync Versus Exchange RBAC
- Default Roles
- Creating New Roles
- Using the Lync Topology Model
- Managing Servers and Users
- Configuring Quality of Service
- Troubleshooting
- Best Practices
- Summary
- Administration Overview
- Chapter 15. High-Availability and Disaster Recovery
- Defining Business Requirements for High-Availability and Disaster Recovery
- Designing for High-Availability
- Understanding High-Availability
- High-Availability Options in Lync Server 2013
- What Services Are Supported for Lync High-Availability?
- SQL Server Backend High-Availability
- File Share High-Availability
- Lync Front End Server High-Availability
- Lync Edge Server High-Availability
- Lync Mediation Server High-Availability
- Persistent Chat High-Availability
- Shared Components High-Availability
- Designing for Disaster Recovery
- Defining Disaster Recovery
- Disaster Recovery Options in Lync Server 2013
- What Services Are Supported for Lync Disaster Recovery?
- SQL Server Backend Disaster Recovery
- Lync Front End Server Disaster Recovery
- Lync Edge Server Disaster Recovery
- Lync Mediation Server Disaster Recovery
- Persistent Chat Disaster Recovery
- Shared Components Disaster Recovery
- Configuring Lync Server for High-Availability
- Configuring SQL Server Mirroring
- Configuring SQL Server Mirroring During Pool Creation in Topology Builder
- Configuring SQL Server Mirroring on Existing Front End Server Pools
- Failing Over a Failed SQL Store to the SQL Server Mirror
- Configuring Front End Server Pools
- Configuring a Front End Server Enterprise Edition Pool
- Configuring DNS Load Balancing for Enterprise Edition Pools
- Configuring File Shares
- Configuring Persistent Chat Server Pools
- Executing Disaster Recovery Procedures
- Summary
- Chapter 13. Monitoring Lync Server 2013
- Part V: Migrating from Older Versions
- Part VI: Lync Voice, Video, and Integration
- Chapter 17. Lync Telephony and Voice Integration
- Chapter 18. Advanced Lync Voice Configuration
- Building the Lync Topology
- Defining Mediation Pools
- Defining PSTN Gateways
- Defining Additional Trunk Associations
- Defining Branch Sites
- Defining Survivable Branch Appliances and Servers
- Deploying a Survivable Branch Appliance
- Adding the Survivable Branch Appliance to Active Directory
- Defining the Service Principal Name
- Installing a Survivable Branch Appliance
- Voice Routing
- Configuring a Dial Plan
- Creating Normalization Rules
- Configuring Voice Policies
- Creating Voice Routes
- Creating PSTN Usages
- Creating a Trunk Configuration
- Configuring Inter-Trunk Routing
- Creating Translation Rules
- Publishing Voice Configuration Changes
- Export and Import Voice Configuration
- Creating Test Cases
- Voice Features
- Advanced Enterprise Voice Features
- Defining the Network Configuration
- Creating Network Regions
- Creating Network Sites
- Creating Network Subnets
- Configuring Call Admission Control
- Defining Bandwidth Policy
- Associate Bandwidth Policy Profile
- Network Region Links
- Creating Network Region Routes
- Creating Network Inter-Site Policies
- Enabling Call Admission Control
- Media Bypass
- Enabling Media Bypass
- Creating Bypass IDs
- Configuring E911
- Configuring Site Locations
- Validating Civic Addresses
- Create Location Policy
- Dial-In Conferencing
- Response Groups
- Configuring Agent Groups
- Understanding Routing Methods in Agent Groups
- Creating an Agent Group
- Configuring Queues
- Creating a Queue
- Configuring Workflows
- Creating Workflows
- Creating a Hunt Group Workflow
- Creating an Interactive Workflow
- Configuring Business-Hour Collections
- Configuring Holiday Sets
- Creating Workflows Using the Lync Server Management Shell
- Best Practices
- Building the Lync Topology
- Chapter 19. Lync Native Video and Data Conferencing
- Chapter 20. Video Integration with Third-Party Products and Services
- Part VII: Integration with Other Applications
- Chapter 21. Exchange and SharePoint Integration
- Server-to-Server Authentication
- Exchange Integration Features
- Unified Contact Store
- Migrating Users to Unified Contact Store
- Selectively Enabling Users for Unified Contact Store
- Unified Contact Store Rollback Procedure
- Lync Archiving Integration
- Archiving Policies in Lync and Exchange
- Archiving Configuration
- High-Resolution Photos
- Uploading Photos Using the Exchange Management Shell
- Uploading Photos Using Outlook Web App
- Outlook Web App Integration
- Unified Messaging Voice Mail Integration
- Exchange UM Components
- Exchange UM Configuration for Lync
- Lync Configuration for Exchange UM
- Testing the UM Integration
- SharePoint Integration Features
- Summary
- Chapter 21. Exchange and SharePoint Integration
- Part VIII: Office 365 and Lync Online
- Chapter 22. Lync Online and Hybrid Deployments
- Overview of Lync Online and Office 365
- System Requirements
- Experiencing Lync Online
- Deploying Lync Online
- Adding Domains to Lync Online/Office 365
- Adding Lync Online User Accounts
- Adding User Accounts Using the Online Portal
- Adding User Accounts Using PowerShell
- Adding User Accounts in Bulk
- Preparing Client Systems for Lync Online
- Configuring Federation and Public IM
- Configuring Dial-in Conferencing
- Configuring Lync Properties for User Accounts
- Configuring Lync-to-Phone
- Configuring Exchange UM Integration
- Creating a SIP URI Dial Plan
- Enabling Users for Exchange UM
- Configuring an Auto Attendant Number
- Configuring a Subscriber Access Number
- AD FS Deployment for SSO
- Preparing Systems for AD FS
- Preparing the Network for AD FS
- Installing AD FS Software
- Configuring the First Federation Server in the Farm
- Adding Federation Servers to the Farm
- Verifying That the Federation Service Is Operational
- Federation Server Proxy Configuration
- Verifying That the Federation Proxy Is Operational
- Establishing Trust with Office 365 for SSO
- Installing the Microsoft Online Services Module
- Adding or Converting a Domain for SSO
- Configuring Directory Synchronization
- Lync Hybrid Deployment
- Summary
- Chapter 22. Lync Online and Hybrid Deployments
- Part IX: Lync Server 2013 Clients
- Chapter 23. Mac Client
- Chapter 24. Mobile Clients
- Mobile Clients Overview
- Lync Server 2013 Mobility Technical Review
- Deploying Lync 2013 Mobility
- Certificate and DNS Requirements
- DNS Requirements for Push Notifications
- Certificate Requirements for LyncDiscover
- Federation Requirements for Push Notifications
- Reverse Proxy and Hardware Load Balancer Considerations for Mobility
- Reverse Proxy Certificate Requirements
- Hardware Load Balancer Requirements
- Network and Security Considerations for Mobility
- Firewall Rules Required for Lync Mobile
- Steps to Enable Mobility
- DNS Configuration for the LyncDiscover Service
- Configurations for Proper Certificate Configuration
- Configurations for Push Notifications
- Enable Mobility for Users
- Controlling Functionality with Mobility Policies
- User Policies for Lync Mobile
- Server Policies for Lync Mobile
- Summary
- Chapter 25. Windows Client
- Chapter 26. Browser Client
- Lync 2013 Browser Capabilities
- Lync Server 2013 Web App Technical Review
- Requirements to Deploy Lync 2013 Browser Functionality
- Installing Lync Web App Server
- Configuring Lync Web App
- Enabling Lync Web App Access for Anonymous Users
- Lync Web App Conferencing Policies
- Publishing Lync Web App Service to External Clients
- Operating System Requirements for Lync 2013 Web App Client
- Browser Requirements for Lync 2013 Web App Client
- Summary
- Chapter 27. Lync and VDI
- Part X: Planning for Deployment
- Chapter 28. Planning for Lync Online and Hybrid Deployments
- Comparing Topologies
- Lync Online and Office 365 Subscription Plans
- Planning for Lync Online
- Lync Online Identity Scenarios
- Cloud Identity
- Cloud Identity + Directory Synchronization
- Federated Identity
- Planning Lync Online Administration
- Planning the SIP Namespace
- Planning the Network for Lync Online
- Planning Internet Connection Bandwidth for Lync Online
- Firewall Port Requirements for Lync Online
- DNS Requirements for Lync Online
- Planning for Federation and Public IM
- Planning for Dial-in Audio Conferencing
- Planning for Hosted Voice Using Lync-to-Phone
- Planning for Exchange UM Integration
- Planning for Single Sign-On with AD FS
- Preparing Active Directory for SSO
- Planning Active Directory Federated Services for SSO
- Planning the AD FS Topology
- Choosing the AD FS Database Platform
- Planning for External Access to AD FS
- Planning AD FS Hardware
- Planning AD FS Certificates
- Planning the Network for AD FS
- Planning Browser Support for AD FS
- Planning for Directory Synchronization
- Planning for a Hybrid Deployment
- Summary
- Chapter 29. Virtualization Support
- Chapter 30. Planning for Basic Lync Services
- Determining the Scope of the Deployment
- Determining Your Infrastructure Needs
- Planning for Capacity
- Planning for IM
- Planning for Conferencing
- Planning for Clients and Devices
- Planning for Archiving
- Defining Your Archiving Requirements
- Planning for Management
- Documenting the Plan
- Best Practices
- Summary
- Chapter 31. Planning to Deploy External Services
- Chapter 32. Planning for Voice Deployment
- Chapter 28. Planning for Lync Online and Hybrid Deployments
- Part XI: Endpoints
- Index
Collecting and Analyzing Performance Monitor Data
The Performance Monitor utility enables administrators to collect data and view it in real time, or to collect data over a period and report on that data when collection has been stopped. For collecting a performance baseline, the latter approach is more appropriate. This feature, called Data Collection Sets, allows a number of counters and various other settings to be combined into a single collection activity. To create a data collector set for Lync Server 2013, perform the following steps:
1. Open the Performance Monitor utility, located in the Administrative Tools on a Windows Server.
2. Expand Data Collector Sets and select User Defined. Right-click and choose New, and then Data Collector Set. See Figure 13.3 for an example.

3. On the Create New Data Collector Set screen, enter a name such as Lync Server Baseline, and select the option for Create Manually (Advanced). Figure 13.4 shows an example of this process. Click Next to continue.

4. Choose the option to Create Data Logs and check the box for Performance Counter. Click Next to continue.
5. Add the performance counters outlined in the preceding section to the list, and choose a sample interval. Keep in mind, the smaller the sample interval, the larger the data logs will be. When you are finished, the list should look similar to that shown in Figure 13.5. Click Next to continue.

6. On the next page, enter a path to save the data files. By default, these are stored on the system drive in a PerfLogs folder. If you have a separate disk to store these on, it is important to define this here. Click Finish to complete the wizard.
7. The new data collector set now shows in the user-defined list. If you want to apply other settings such as a schedule, or stop conditions based on disk space or duration, right-click on the collector set and choose Properties.
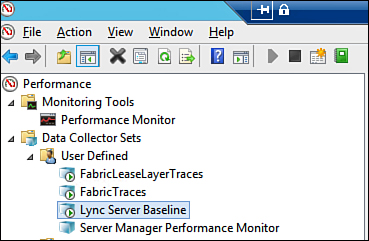
8. When you are ready to begin collecting data, right-click on the data collector set and choose Start. When the set is running, it displays a running symbol over the icon (which is green), as shown in Figure 13.6.
Analyzing Performance Monitor Data Logs
Perform the following steps to analyze Performance Monitor data logs collected using the data collection set created in the preceding section.
1. Right-click on the data collection set and choose Stop.
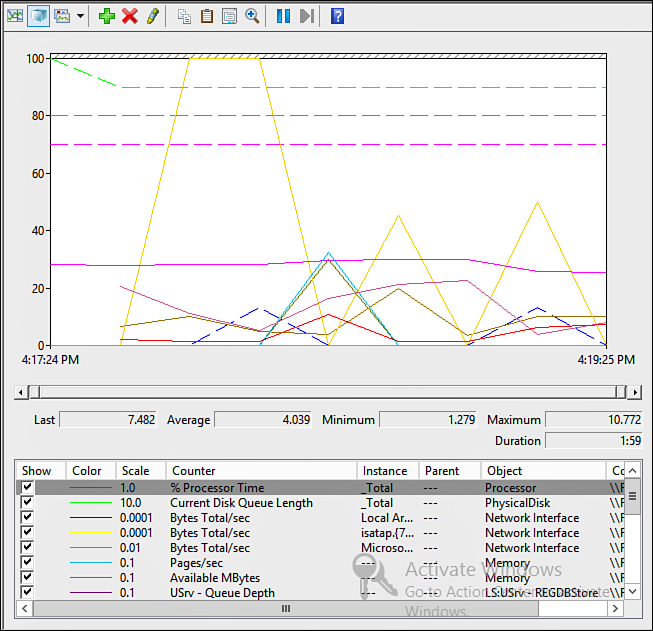
2. Right-click on the data collection set and choose Latest Report. The report should automatically appear, enabling you to analyze the data collected. Use this screen to view a graph, or a numeric representation of each value. When you select each value, you are presented with the Last, Average, Minimum, and Maximum values for each counter. Compare these numbers with the acceptable values described in earlier sections to determine the health of your environment. See Figure 13.7 for a sample report.
In addition to the reports built into Performance Monitor, a community tool is available to analyze Performance Monitor data logs and provide feedback based on known thresholds. The tool, named Performance Analysis of Logs (PAL), reads performance logs generated by Performance Monitor, analyzes them, and then outputs an HTML report that attempts to call out critical areas based on known thresholds. Although this is not built specifically for Lync Server 2013, it does understand basic thresholds from Office Communications Server 2007 R2, as well as the Windows operating system thresholds. The goal of PAL is to automate the analysis work, and provide administrators with a clear definition of counters that show a problem with a system. Also, you can edit and add threshold files for models that PAL does not support. To download PAL, see the following link: http://pal.codeplex.com/.
Performance Monitor is a powerful tool. Lync administrators should be familiar with the counters available to them. Not only will this be helpful for planning purposes, but it has produced great results in troubleshooting scenarios as well.
-
No Comment