
Operations Module Managing Operations
The steaming cup of coffee placed in a customer’s hand at any Starbucks store location starts as coffee beans (berries) plucked from fields of coffee plants. From harvest to storage to roasting to retail to cup, Starbucks understands the important role each value chain participant plays.
Starbucks offers a selection of coffees from around the world, and its coffee buyers personally travel to the coffee-growing regions of Latin America, Africa/Arabia, and Asia/Pacific to select and purchase the highest-quality arabica beans. Once the beans arrive at any one of its five roasting facilities (in Washington, Pennsylvania, Nevada, South Carolina, or Amsterdam), Starbucks’ master professional roasters do their “magic” in creating the company’s rich signature roast coffees, a process that’s the “cumulative result of expert roasters knowing coffee and bringing balance to all of its flavor attributes.” There are many potential challenges in “transforming” the raw material into the quality product and experience that customers expect at Starbucks—weather, shipping and logistics, technology, political instability, and so forth. All could potentially affect the company. Although those operations management challenges are significant, the most challenging issue facing Starbucks today is balancing its vision of the uniquely Starbucks’ coffee experience with the realities of selling a $4 latte in today’s world.
Every organization produces something, whether it’s a good or a service. Some, like Starbucks, produce both a good and a service. Technology has changed how production is done. This module focuses on how organizations manage operations and the important role that managers play in that process.
What Do I Need to Know About Operations Management?
You’ve probably never given much thought to how organizations “produce” the goods and services that you buy or use. But it’s an important process. Without it, you wouldn’t have a car to drive or McDonald’s fries to snack on or even a hiking trail in a local park to enjoy. Organizations need to have well-thought-out and well-designed operating systems, organizational control systems, and quality programs to survive in today’s increasingly competitive global environment. And it’s the manager’s job to manage those things.
What Is Operations Management?
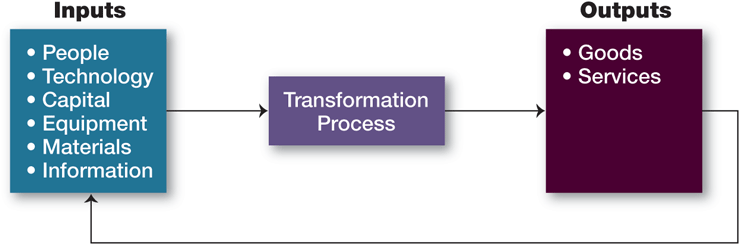
The term operations management refers to the design, operation, and control of the transformation process that converts such resources as labor and raw materials into goods and services that are sold to customers. Exhibit MOM–1 portrays a simplified overview of the transformation process of creating value by converting inputs into outputs. The system takes inputs—people, technology, capital, equipment, materials, and information—and transforms them through various processes, procedures, and work activities into finished goods and services. These processes, procedures, and work activities are found throughout the organization. For example, department members in marketing, finance, research and development, human resources, and accounting convert inputs into outputs such as sales, increased market share, high rates of return on investments, new and innovative products, motivated and committed employees, and accounting reports. As a manager, you’ll need to be familiar with operations management concepts, regardless of the area in which you’re managing, in order to achieve your goals more effectively and efficiently.
Exhibit MOM–1
The Operations System
Why Is Operations Management Important?
It encompasses processes in services and manufacturing organizations.
It’s important in effectively and efficiently managing productivity.
It plays a strategic role in an organization’s competitive success.
1 How Do Service and Manufacturing Firms Differ?
With a menu that offers more than 250 items made fresh each day, The Cheesecake Factory restaurants rely on a finely tuned production system. One food-service consultant says, “They’ve evolved with this highly complex menu combined with a highly efficient kitchen.”1
All organizations produce goods or services through the transformation process. Simply stated, every organization has an operations system that creates value by transforming inputs into finished goods and services outputs. For manufacturers, the products are obvious: cars, cell phones, or food products. After all, manufacturing organizations produce physical goods. It’s easy to see the operations management (transformation) process at work in these types of organizations because raw materials are turned into recognizable physical products. But that transformation process isn’t as readily evident in service organizations because they produce nonphysical outputs in the form of services. For instance, hospitals provide medical and health care services that help people manage their personal health; taxi companies provide transportation services that move people from one location to another; cruise lines provide vacation and entertainment services; residential plumbers and electricians ensure that we have electricity and running water where we live. All of these service organizations transform inputs into outputs. For example, look at your college. College administrators bring together inputs—instructors, books, multimedia classrooms, and similar resources—to transform students into educated and skilled individuals.
The reason we’re making this point is that the U.S. economy—and, to a large extent, the global economy—is dominated by the creation and sale of services. Most of the world’s developed countries are predominantly service economies.2 In the United States, for instance, almost 78 percent of all economic activity is services, and in the European Union, it’s nearly 73 percent. In lesser-developed countries, the services sector is less important. For instance, in Chad, it accounts for only 32 percent of economic activity; in Laos, only 44 percent; and in Bolivia, 48 percent.
2 How Do Businesses Improve Productivity?
![]() One jetliner has some 4 million parts. Efficiently assembling such a finely engineered product requires intense focus. Boeing and Airbus, the two major global manufacturers, have copied techniques from Toyota. However, not every technique can be copied because airlines demand more customization than do car buyers, and there are significantly more rigid safety regulations for jetliners than for cars.3 At the Evans Findings Company in East Providence, Rhode Island, which makes the tiny cutting devices on dental-floss containers, one production shift each day is run without people.4 The company’s goal is to do as much as possible with no labor. And it’s not because they don’t care about their employees. Instead, like many U.S. manufacturers, Evans needed to improve productivity in order to survive, especially against low-cost competitors. So they turned to “lights-out” manufacturing, where machines are designed to be so reliable that they make flawless parts on their own, without people operating them.
One jetliner has some 4 million parts. Efficiently assembling such a finely engineered product requires intense focus. Boeing and Airbus, the two major global manufacturers, have copied techniques from Toyota. However, not every technique can be copied because airlines demand more customization than do car buyers, and there are significantly more rigid safety regulations for jetliners than for cars.3 At the Evans Findings Company in East Providence, Rhode Island, which makes the tiny cutting devices on dental-floss containers, one production shift each day is run without people.4 The company’s goal is to do as much as possible with no labor. And it’s not because they don’t care about their employees. Instead, like many U.S. manufacturers, Evans needed to improve productivity in order to survive, especially against low-cost competitors. So they turned to “lights-out” manufacturing, where machines are designed to be so reliable that they make flawless parts on their own, without people operating them.
Although most organizations don’t make products that have 4 million parts and most organizations can’t function without people, improving productivity has become a major goal in virtually every organization. For countries, high productivity can lead to economic growth and development. Employees can receive higher wages and company profits can increase without causing inflation. For individual organizations, increased productivity gives them a more competitive cost structure and the ability to offer more competitive prices.
Over the past decade, U.S. businesses have made dramatic improvements to increase their efficiency. For example, at Latex Foam International’s state-of-the-art digital facility in Shelton, Connecticut, engineers monitor all of the factory’s operations. The facility boosted capacity by 50 percent in a smaller space and achieved a 30 percent efficiency gain.5 And it’s not just in manufacturing that companies are pursuing productivity gains. Pella Corporation’s purchasing office improved productivity by reducing purchase order entry times anywhere from 50 percent to 86 percent, decreasing voucher processing by 27 percent, and eliminating 14 financial systems. Its information technology department slashed e-mail traffic in half and implemented work design improvements for heavy PC users such as call center users. The human resources department cut the time to process benefit enrollment by 156.5 days. And the finance department now takes two days, instead of six, to do its end-of-month closeout.6
Organizations that hope to succeed globally are looking for ways to improve productivity. For example, McDonald’s Corporation drastically reduced the time it takes to cook french fries—65 seconds as compared to the 210 seconds it once took, saving time and other resources.7 The Canadian Imperial Bank of Commerce, based in Toronto, automated its purchasing function, saving several million dollars annually.8 And Skoda, the Czech car company, improved its productivity through an intensive restructuring of its manufacturing process.9
Productivity is a composite of people and operations variables. To improve productivity, managers must focus on both. The late W. Edwards Deming, a renowned quality expert, believed that managers, not workers, were the primary source of increased productivity. He outlined 14 points for improving management’s productivity. Here’s a quick overviewof his work:
William Edwards Deming was an American statistician, professor, author, lecturer, and consultant.10 He is widely credited with improving production in the United States during World War II, although he’s probably best known for his work in Japan. From 1950 onward, he taught Japanese top managers how to improve product design and product quality, testing, and sales, primarily through applying statistical methods. His philosophy has been summarized as follows: “Dr. W. Edwards Deming taught that by adopting appropriate principles of management, organizations can increase quality and simultaneously reduce costs (by reducing waste, rework, staff attrition and litigation while increasing customer loyalty). The key is to practice continual improvement and think of manufacturing as a system, not as bits and pieces.”
Putting that philosophy into practice required following Deming’s 14 points for improving management’s productivity. These suggestions are as follows:
Plan for the long-term future.
Never be complacent concerning the quality of your product.
Establish statistical control over your production processes and require your suppliers to do so as well.
Deal with the best and fewest number of suppliers.
Find out whether your problems are confined to particular parts of the production process or stem from the overall process itself.
Train workers for the job that you are asking them to perform.
Raise the quality of your line supervisors.
Drive out fear.
Encourage departments to work closely together rather than to concentrate on departmental or divisional distinctions.
Do not adopt strictly numerical goals.
Require your workers to do quality work.
Train your employees to understand statistical methods.
Train your employees in new skills as the need arises.
Make top managers responsible for implementing these principles.
These principles have withstood the test of time and are still applicable for managers looking to improve productivity.
A close look at these suggestions reveals Deming’s understanding of the interplay between people and operations. High productivity can’t come solely from good “people management.” The truly effective organization will maximize productivity by successfully integrating people into the overall operations system. For instance, at Simplex Nails Manufacturing in Americus, Georgia, employees were an integral part of the company’s much-needed turnaround effort.11 Some production workers were redeployed on a plant-wide cleanup and organization effort, which freed up floor space. The company’s sales force was retrained and refocused to sell what customers wanted rather than what was in inventory. The results were dramatic. Inventory was reduced by more than 50 percent, the plant had 20 percent more floor space, orders were more consistent, and employee morale improved. Here’s a company that understood the important interplay between people and the operations system.
3 What Role Does Operations Management Play in a Company’s Strategy?
Modern manufacturing originated more than 110 years ago in the United States, primarily in Detroit’s automobile factories. The success that U.S. manufacturers experienced during World War II led manufacturing executives to believe that troublesome production problems had been conquered. These executives focused, instead, on improving other functional areas such as finance and marketing and paid little attention to manufacturing.
However, as U.S. executives neglected production, managers in Japan, Germany, and other countries took the opportunity to develop modern, technologically advanced facilities that fully integrated manufacturing operations into strategic planning decisions. The competition’s success realigned world manufacturing leadership. U.S. manufacturers soon discovered that foreign goods were being made not only less expensively but also with better quality. Finally, by the late 1970s, U.S. executives recognized that they were facing a true crisis and responded. They invested heavily in improving manufacturing technology, increased the corporate authority and visibility of manufacturing executives, and began incorporating existing and future production requirements into the organization’s overall strategic plan. Today, successful organizations recognize the crucial role that operations management plays as part of the overall organizational strategy to establish and maintain global leadership.12
The strategic role that operations management plays in successful organizational performance can be seen clearly as more organizations move toward managing their operations from a value chain perspective.
What Is Value Chain Management and Why Is It Important?
It’s 11 p.m., and you’re reading a text message from your parents saying they want to buy you a laptop for your birthday this year and to order it. You log on to Dell’s website and configure your dream machine. You hit the order button and within two to three days, your dream computer is delivered to your front door, built to your exact specifications, ready to set up and use immediately to finish that online management assignment due tomorrow. Or consider Siemens AG’s Computed Tomography manufacturing plant in Forchheim, Germany, which has established partnerships with about 30 suppliers. These suppliers are partners in the truest sense because they share responsibility with the plant for overall process performance. This arrangement has allowed Siemens to eliminate all inventory warehousing and has streamlined the number of times paper changes hands to order parts from 18 to one. At the Timken’s plant in Canton, Ohio, electronic purchase orders are sent across the street to an adjacent “Supplier City” where many of its key suppliers have set up shop. The process takes milliseconds and costs less than 50 cents per purchase order. And when Black & Decker extended its line of handheld tools to include a glue gun, it totally outsourced the entire design and production to the leading glue gun manufacturer. Why? Because they understood that glue guns don’t require motors, which was what Black & Decker did best.13
As these examples show, closely integrated work activities among many different players are possible. How? The answer lies in value chain management. The concepts of value chain management have transformed operations management strategies and turned organizations around the world into finely tuned models of efficiency and effectiveness strategically positioned to exploit competitive opportunities.
What Is Value Chain Management?
Every organization needs customers if it’s going to survive and prosper. Even a not-for-profit organization must have “customers” who use its services or purchase its products. Customers want some type of value from the goods and services they purchase or use, and these customers decide what has value. Organizations must provide that value to attract and keep customers. Value is defined as the performance characteristics, features and attributes, and any other aspects of goods and services for which customers are willing to give up resources (usually money). For example, when you download Ariana Grande’s new single on Amazon Music, buy a new pair of Australian sheepskin Ugg boots online at the company’s website, purchase a Wendy’s bacon cheeseburger at the drive-through location on campus, or get a haircut from your local hair salon, you’re exchanging (giving up) money in return for the value you need or desire from these products—providing music during your evening study time, keeping your feet warm and fashionable during winter’s cold weather, alleviating the lunchtime hunger pangs quickly since your next class starts in 15 minutes, or looking professionally groomed for the job interview you’ve got next week.
How is value provided to customers? Through transforming raw materials and other resources into some product or service that end users need or desire when, where, and how they want it. However, that seemingly simple act of turning varied resources into something that customers value and are willing to pay for involves a vast array of interrelated work activities performed by different participants (suppliers, manufacturers, and even customers)—that is, it involves the value chain. The value chain is the entire series of organizational work activities that add value at each step from raw materials to finished product. In its entirety, the value chain can encompass the supplier’s suppliers to the customer’s customer.14
Value chain management is the process of managing the sequence of activities and information along the entire value chain. In contrast to supply chain management, which is internally oriented and focuses on efficient flow of incoming materials (resources) to the organization, value chain management is externally oriented and focuses on both incoming materials and outgoing products and services. Although supply chain management is efficiency oriented (its goal is to reduce costs and make the organization more productive), value chain management is effectiveness oriented and aims to create the highest value for customers.15
What Are the Goals of Value Chain Management?
Who has the power in the value chain? Is it the supplier providing needed resources and materials? After all, suppliers have the ability to dictate prices and quality. Is it the manufacturer that assembles those resources into a valuable product or service? A manufacturer’s contribution in creating a product or service is quite obvious. Is it the distributor that makes sure the product or service is available where and when the customer needs it? Actually, it’s none of these. In value chain management, ultimately customers are the ones with the power.16 They’re the ones who define what value is and how it’s created and provided. Using value chain management, managers seek to find that unique combination in which customers are offered solutions that truly meet their needs and at a price that can’t be matched by competitors.17 For example, in an effort to better anticipate customer demand and replenish customer stocks, Shell Chemical Company developed a supplier inventory management order network. The software used in this network allows managers to track shipment status, calculate safety stock levels, and prepare resupply schedules.18 With this capability, Shell Chemical enables its customers to purchase goods when desired and to receive them immediately.
A good value chain is one in which a sequence of participants works together as a team, each adding some component of value—such as faster assembly, more accurate information, or better customer response and service—to the overall process.19 The better the collaboration among the various chain participants, the better the customer solutions. When value is created for customers and their needs and desires are satisfied, everyone along the chain benefits. For example, at Iomega Corporation, a manufacturer of personal computer storage devices, managing the value chain started first with improved relationships with internal suppliers, then expanded out to external suppliers and customers. As the company’s experience with value chain management intensified and improved, so did its connection to customers, which ultimately paid off for all its value chain partners.20
How Does Value Chain Management Benefit Businesses?
Collaborating with external and internal partners in creating and managing a successful value chain strategy requires significant investments in time, energy, and other resources plus a serious commitment by all chain partners. Given this, why would managers ever choose to implement value chain management? A survey of manufacturers noted four primary benefits of value chain management: improved procurement, improved logistics, improved product development, and enhanced customer order management.21
How Is Value Chain Management Done?
The dynamic, competitive environment facing contemporary global organizations demands new solutions.22 Understanding how and why value is determined by the marketplace has led some organizations to experiment with a new business model—that is, a strategic design for how a company intends to profit from its broad array of strategies, processes, and activities. For example, IKEA, the home furnishings manufacturer, transformed itself from a small, Swedish mail-order furniture operation into the world’s largest retailer of home furnishings by reinventing the value chain in the home furnishings industry. The company offers customers well-designed products at substantially lower prices in return for the customers’ willingness to take on certain key tasks traditionally done by manufacturers and retailers—such as getting the furniture home and assembling it.23 The company’s adoption of a unique business model and willingness to abandon old methods and processes have worked well. It also helped that IKEA recognized the importance of managing its value chain.
What Are the Requirements for Successful Value Chain Management?
So what does successful value chain management require? Exhibit MOM–2 summarizes the six main requirements. Let’s look at each of these elements more closely.
Exhibit MOM–2
Requirements for Successful Value Chain Management

Coordination and Collaboration. For the value chain to achieve its goal of meeting and exceeding customers’ needs and desires, comprehensive and seamless integration among all members of the chain is absolutely necessary. All partners in the value chain must identify things that they may not value but that customers do. Sharing information and being flexible as far as who in the value chain does what are important steps in building coordination and collaboration. This sharing of information and analysis requires open communication among the various value chain partners. For example, Furon Company, a manufacturer of specialty polymer products, believes that better communication with customers and with suppliers has facilitated timely delivery of goods and services and opened up additional business opportunities for all its value chain partners.24
Technology Investment. Successful value chain management isn’t possible without a significant investment in information technology. The payoff from this investment is that information technology can be used to restructure the value chain to better serve end users.25 For example, Rollerblade Inc., invested heavily in developing a website and used it to educate customers about its products. Although the company has chosen not to sell its products over the Web for fear of antagonizing its dealer network, managers remain flexible about the issue and would reconsider if they felt that value could be better delivered to customers by doing so.26
What types of technology are important? According to experts, the key tools include a supporting enterprise resource planning (ERP) software system that links all of an organization’s activities, sophisticated work planning and scheduling software, customer relationship management systems, business intelligence capabilities, and e-business connections with trading network partners.27 For instance, Dell Inc. manages its supplier relationships almost exclusively online. The company has one website for customers and one for suppliers. The supplier website is the primary mode of communication between Dell and its largest suppliers. The company’s investment in this type of information technology allows it to meet customers’ needs in a way that competitors haven’t been able to match.28
Organizational Processes. Value chain management radically changes organizational processes—that is, the way organizational work is done.29 Managers must critically evaluate all organizational processes from beginning to end by looking at core competencies—the organization’s unique skills, capabilities, and resources—to determine where value is being added. Non-value-adding activities are eliminated. Questions such as “Where can internal knowledge be leveraged to improve flow of material and information?” “How can we better configure our product to satisfy both customers and suppliers?” “How can the flow of material and information be improved?” and “How can we improve customer service?” should be asked for each process. For example, when managers at Deere & Company implemented value chain management in its Worldwide Commercial and Consumer Equipment Division, a thorough process evaluation revealed that work activities needed to be better synchronized and interrelationships between multiple links in the value chain better managed. They changed numerous work processes division-wide in order to improve these relationships.30
Three important conclusions can be made about how organizational processes must change:
First, better demand forecasting is necessary and possible because of closer ties with customers and suppliers. For example, in an effort to make sure that Listerine was on the store shelves when customers wanted it, Walmart collaborated with product manufacturer Pfizer Consumer Healthcare on improving product demand forecast information. Through their mutual efforts, the partners boosted Walmart’s sales of Listerine by $6.5 million. Customers also benefited because they were able to purchase the product when and where they wanted it.
Second, selected functions may need to be done collaboratively with other partners in the value chain. This collaboration may even extend to sharing employees. For instance, Saint-Gobain Performance Plastics, headquartered in Northboro, Massachusetts, places its own employees in customer sites and brings employees of suppliers and customers to work on its premises. Saint-Gobain’s CEO says this type of collaboration is essential.31
Finally, new measures are needed for evaluating the performance of various activities along the value chain. Because the goal in value chain management is meeting and exceeding customers’ needs and desires, managers need a better picture of how well value is being created and delivered to customers. For instance, when Nestlé USA implemented a value chain management approach, it redesigned its measurement system to focus on one consistent set of factors, including accuracy of demand forecasts and production plans, on-time delivery, and customer service levels. This redesign allowed management to more quickly identify problems and take actions to resolve them.32
Leadership. The importance of leadership to value chain management is plain and simple—successful value chain management isn’t possible without strong and committed leadership.33 From top organizational levels to lower levels, managers must support, facilitate, and promote the implementation and ongoing practice of value chain management. Managers must make a serious commitment to identifying what value is, how that value can best be provided, and how successful those efforts have been. That type of organizational atmosphere or culture, in which all efforts are focused on delivering superb customer value, isn’t possible without a serious commitment on the part of the organization’s leaders.
Also, it’s important that leaders outline expectations for what’s involved in the organization’s pursuit of value chain management. Ideally, articulating expectations should start with a vision or mission statement that expresses the organization’s commitment to identifying, capturing, and providing the highest possible value to customers. For example, when American Standard Companies began its pursuit of value chain management, the CEO attended dozens of meetings across the country explaining the changing competitive environment and why the company needed to create better working relationships with its value chain partners.34 Throughout the organization, then, managers should clarify expectations regarding each employee’s role in the value chain. Being clear about expectations also extends to partners. For example, managers at American Standard identified clear requirements for suppliers and were prepared to drop any that couldn’t meet them. The company was so serious about its expectations that it did cut hundreds of suppliers from air-conditioning, bath and kitchen, and vehicle control systems businesses. The upside, though, was that those suppliers that met the expectations benefited from more business and American Standard had partners that could deliver better value to customers.
Employees/Human Resources. We know from our discussions of management theories and approaches throughout this textbook that employees are the organization’s most important resource. So, not surprisingly, employees play an important part in value chain management. Three main human resources requirements for value chain management are flexible approaches to job design, an effective hiring process, and ongoing training.
Flexibility is the key description of job design in a value chain management organization. Traditional functional job roles—such as marketing, sales, accounts payable, customer service representative, and so forth—are inadequate in a value chain management environment. Instead, jobs need to be designed around work processes that link all functions involved in creating and providing value to customers. This type of flexible job design supports the company’s commitment to providing superb customer value.35 In designing jobs for a value chain approach, the focus needs to be on how each activity performed by an employee can best contribute to the creation and delivery of customer value, which requires flexibility in what employees do and how they do it.
The fact that jobs in a value chain management organization must be flexible contributes to the second requirement: Flexible jobs require employees who are flexible. In a value chain organization, employees may be assigned to work teams that tackle a given process and are often asked to do different things on different days, depending on need. In an environment focusing on collaborative relationships that may change as customer needs change, employees’ ability to be flexible is critical. Accordingly, the organization’s hiring process must be designed to identify those employees who have the ability to quickly learn and adapt.
Finally, the need for flexibility also requires a significant investment in ongoing employee training. Whether the training involves learning how to use information technology software, how to improve the flow of materials throughout the chain, how to identify activities that add value, how to make better decisions faster, or how to improve any number of other potential work activities, managers must see to it that employees have the knowledge and tools they need to do their jobs. For example, at defense and electronics contractor Alenia Marconi Systems, based in Portsmouth, England, ongoing training is part of the company’s commitment to efficiently and effectively meeting the needs of customers. Employees continually receive technical training as well as training in strategic issues, including the importance of emphasizing people and customers, not just sales and profits.36
Organizational Culture and Attitudes. The last requirement for value chain management is having a supportive organizational culture and attitudes. Those cultural attitudes include sharing, collaborating, openness, flexibility, mutual respect, and trust. And these attitudes encompass not only the internal partners in the value chain, but external partners as well. For instance, American Standard has chosen to practice these attitudes the old-fashioned way—with lots of face time and telephone calls. However, as we mentioned earlier, Dell has taken a completely different approach becasue it works with its value chain partners almost exclusively through cyberspace.37 Both approaches, however, reflect each company’s commitment to developing long-lasting, mutually beneficial, and trusting relationships that best meet customers’ needs.
What Are the Obstacles to Value Chain Management?
As desirable as value chain management may be, managers must tackle several obstacles in managing the value chain—organizational barriers, cultural attitudes, required capabilities, and people (see Exhibit MOM–3).
Exhibit MOM–3
Obstacles to Successful Value Chain Management

Organizational Barriers
Organizational barriers are among the most difficult obstacles to handle. These barriers include refusal or reluctance to share information, reluctance to shake up the status quo, and security issues. Without shared information, close coordination and collaboration is impossible. And the reluctance or refusal of employees to shake up the status quo can impede efforts toward value chain management and prevent its successful implementation. Finally, because value chain management relies heavily on a substantial information technology infrastructure, system security and Internet security breaches are issues that need to be addressed.
Cultural Attitudes
Unsupportive cultural attitudes—-especially trust and control—also can be obstacles to value chain management. The trust issue is a critical one—both lack of trust and too much trust. To be effective, partners in a value chain must trust each other. There must be a mutual respect for, and honesty about, each partner’s activities all along the chain. When that trust doesn’t exist, the partners will be reluctant to share information, capabilities, and processes. But too much trust also can be a problem. Just about any organization is vulnerable to theft of intellectual property—that is, proprietary information that’s critical to an organization’s efficient and effective functioning and competitiveness. You need to be able to trust your value chain partners so your organization’s valuable assets aren’t compromised.38 Another cultural attitude that can be an obstacle is the belief that when an organization collaborates with external and internal partners, it no longer controls its own destiny. However, this just isn’t the case. Even with the intense collaboration that’s important to value chain management, organizations still control critical decisions such as what customers value, how much value they desire, and what distribution channels are important.39
Required Capabilities
We know from our earlier discussion of requirements for the successful implementation of value chain management that value chain partners need numerous capabilities. Several of these—coordination and collaboration, the ability to configure products to satisfy customers and suppliers, and the ability to educate internal and external partners—aren’t easy. But they’re essential to capturing and exploiting the value chain. Many of the companies we’ve described throughout this section endured critical, and oftentimes difficult, self-evaluations of their capabilities and processes in order to become more effective and efficient at managing their value chains.
People
The final obstacles to successful value chain management can be an organization’s people. Without their unwavering commitment to do whatever it takes, value chain management won’t be successful. If employees refuse to be flexible in their work—how and with whom they work—collaboration and cooperation throughout the value chain will be hard to achieve. In addition, value chain management takes an incredible amount of time and energy on the part of an organization’s employees. Managers must motivate those high levels of effort from employees, which isn’t an easy thing to do.
What Contemporary Issues Do Managers Face in Managing Operations?
![]() Redesigned milk jugs adopted by Walmart and Costco are cheaper to ship, better for the environment, cost less, and keep the milk fresher. Experts say this type of redesign is “an example of the changes likely to play out in the American economy over the next two decades. In an era of soaring global demand and higher costs for energy and materials, virtually every aspect of the economy needs to be re-examined and many products must be redesigned for greater efficiency.”40
Redesigned milk jugs adopted by Walmart and Costco are cheaper to ship, better for the environment, cost less, and keep the milk fresher. Experts say this type of redesign is “an example of the changes likely to play out in the American economy over the next two decades. In an era of soaring global demand and higher costs for energy and materials, virtually every aspect of the economy needs to be re-examined and many products must be redesigned for greater efficiency.”40
If you somehow thought that managing operations didn’t really matter in today’s online 24/7 global economy, think again. It does matter … a lot. Managers face three contemporary issues in managing operations.
1 What Role Does Technology Play in Operations Management?
As we know from our previous discussion of value chain management, today’s competitive marketplace has put tremendous pressure on organizations to deliver products and services that customers value in a timely manner. Smart companies are looking at ways to harness technology to improve operations management. Many fast-food companies are competing to see who can provide faster and better service to drive-through customers. With drive-through now representing a huge portion of sales, faster and better delivery can be a significant competitive edge. For instance, Wendy’s added awnings to some of its menu boards and replaced some of the text with pictures. Others use confirmation screens, a technology that helped McDonald’s boost accuracy by more than 11 percent. And technology used by two national chains tells managers how much food they need to prepare by counting vehicles in the drive-through line and factoring in demand for current promotional and popular staple items.41
Although an organization’s production activities are driven by the recognition that the customer is king, managers still need to be more responsive. For instance, operations managers need systems that can reveal available capacity, status of orders, and product quality while products are in the process of being manufactured, not just after the fact. To connect more closely with customers, production must be synchronized across the enterprise. To avoid bottlenecks and slowdowns, the production function must be a full partner in the entire business system.
What’s making such extensive collaboration possible is technology. Technology is also allowing organizations to control costs, particularly in the areas of predictive maintenance, remote diagnostics, and utility cost savings. For instance, Internet-compatible equipment contains embedded web servers that can communicate proactively—that is, if a piece of equipment breaks or reaches certain preset parameters indicating that it’s about to break, it asks for help. But technology can do more than sound an alarm or light up an indicator button. For instance, some devices have the ability to initiate e-mail or signal a pager at a supplier, the maintenance department, or contractor describing the specific problem and requesting parts and service. How much is such e-enabled maintenance control worth? It can be worth quite a lot if it prevents equipment breakdowns and subsequent production downtime.
Managers who understand the power of technology to contribute to more effective and efficient performance know that managing operations is more than the traditional view of simply producing the product. Instead, the emphasis is on working together with all the organization’s business functions to find solutions to customers’ business problems.
2 How Do Managers Control Quality?
Quality problems are expensive. For example, even though Apple has had phenomenal success with its iPod, the batteries in the first three versions died after four hours instead of lasting up to 12 hours, as buyers expected. Apple’s settlement with consumers cost close to $100 million. At Schering-Plough, problems with inhalers and other pharmaceuticals were traced to chronic quality control shortcomings, for which the company eventually paid a $500 million fine. And the auto industry paid $14.5 billion to cover the cost of warranty and repair work in one year.42
Many experts believe that organizations unable to produce high-quality products won’t be able to compete successfully in the global marketplace. What is quality? When you consider a product or service to have quality, what does that mean? Does it mean that the product doesn’t break or quit working—that is, is it reliable? Does it mean that the service is delivered in a way that you intended? Does it mean that the product does what it’s supposed to do? Or does quality mean something else? Exhibit MOM–4 provides a description of several quality dimensions. We’re going to define quality as the ability of a product or service to reliably do what it’s supposed to do and to satisfy customer expectations.
Exhibit MOM–4
What Is Quality?
| PRODUCT QUALITY DIMENSIONS |
|---|
|
| SERVICE QUALITY DIMENSIONS |
|
Sources: Based on J. W. Dean and J. R. Evans, Total Quality: Management, Organization, and Society (St. Paul, MN: West Publishing Company, 1994); H. V. Roberts and B. F. Sergesketter, Quality Is Personal (New York: The Free Press, 1993); D. Garvin, Managed Quality: The Strategic and Competitive Edge (New York: The Free Press, 1988); and M. A. Hitt, R. D. Ireland, and R. E. Hoskisson, Strategic Management, 4th ed. (Cincinnati: South-Western Publishing, 2001), p. 121.
How Is Quality Achieved?
How quality is achieved is an issue managers must address. A good way to look at quality initiatives is with the management functions—planning, organizing and leading, and controlling—that need to take place.
When planning for quality, managers must have quality improvement goals and strategies and plans to achieve those goals. Goals can help focus everyone’s attention toward some objective quality standard. For instance, Caterpillar’s goal is to apply quality improvement techniques to help cut costs.43 Although this goal is specific and challenging, managers and employees are partnering together to pursue well-designed strategies to achieve the goals, and are confident they can do so.
When organizing and leading for quality, it’s important for managers to look to their employees. For instance, at the Moosejaw, Saskatchewan, plant of General Cable Corporation, every employee participates in continual quality assurance training. In addition, the plant manager believes wholeheartedly in giving employees the information they need to do their jobs better. He says, “Giving people who are running the machines the information is just paramount. You can set up your cellular structure, you can cross-train your people, you can use lean tools, but if you don’t give people information to drive improvement, there’s no enthusiasm.” Needless to say, this company shares production data and financial performance measures with all employees.44
Organizations with extensive and successful quality improvement programs tend to rely on two important people approaches: cross-functional work teams and self-directed or empowered work teams. Because achieving product quality is something that all employees from upper to lower levels must participate in, it’s not surprising that quality-driven organizations rely on well-trained, flexible, and empowered employees.
Finally, managers must recognize when controlling for quality that quality improvement initiatives aren’t possible without having some way to monitor and evaluate their progress. Whether it involves standards for inventory control, defect rate, raw materials procurement, or other operations management areas, controlling for quality is important. For instance, at the Northrup Grumman Corporation plant in Rolling Meadows, Illinois, several quality controls have been implemented, such as automated testing and IT that integrates product design and manufacturing and tracks process quality improvements. Also, employees are empowered to make accept/reject decisions about products throughout the manufacturing process. The plant manager explains, “This approach helps build quality into the product rather than trying to inspect quality into the product.” But one of the most important things they do is “go to war” with their customers—soldiers preparing for war or live combat situations. Again, the plant manager says, “What discriminates us is that we believe if we can understand our customer’s mission as well as they do, we can help them be more effective. We don’t wait for our customer to ask us to do something. We find out what our customer is trying to do and then we develop solutions.”45
Quality improvement success stories can be found globally. For example, at a Delphi assembly plant in Matamoros, Mexico, employees worked hard to improve quality and made significant strides. For instance, the customer reject rate on shipped products is now 10 ppm (parts per million), down from 3,000 ppm—an improvement of almost 300 percent.46 Quality initiatives at several Australian companies—including Alcoa of Australia, Wormald Security, and Carlton and United Breweries—have led to significant quality improvements.47 At Valeo Klimasystemme GmbH of Bad Rodach, Germany, assembly teams build different climate-control systems for high-end German cars, including Mercedes and BMW. Quality initiatives by those teams have led to significant improvements.48
What Quality Goals Might Organizations Pursue?
To publicly demonstrate their commitment to quality, many organizations worldwide have pursued challenging quality goals. The two best-known are the following:
ISO 9001 is a series of international quality management standards established by the International Organization for Standardization (www.iso.org), which sets uniform guidelines for processes to ensure that products conform to customer requirements. These standards cover everything from contract review to product design to product delivery. The ISO 9001 standards have become the internationally recognized standard for evaluating and comparing companies in the global marketplace. In fact, this type of certification can be a prerequisite for doing business globally. Achieving ISO 9001 certification provides proof that a quality operations system is in place.
More than 30 years ago, Motorola further popularized the use of stringent quality standards through a trademarked quality improvement program called Six Sigma.49 Very simply, Six Sigma is a quality standard that establishes a goal of no more than 3.4 defects per million units or procedures. What does the name mean? Sigma is the Greek letter that statisticians use to define a standard deviation from a bell curve. The higher the sigma, the fewer the deviations from the norm—that is, the fewer the defects. At One Sigma, two-thirds of whatever is being measured falls within the curve. Two Sigma covers about 95 percent. At Six Sigma, you’re about as close to defect-free as you can get.50 It’s an ambitious quality goal! Although it’s an extremely high standard to achieve, many quality-driven businesses are using it and benefiting from it. For instance, General Electric estimates that it has saved billions since 1995 by using Six Sigma, according to company executives.51 Other examples of companies pursuing Six Sigma include Amazon, Bank of America, Dow Chemical, 3M Company, American Express, Sony Corporation, Starwood Hotels & Resorts Worldwide, and Johnson & Johnson. Although manufacturers seem to make up the bulk of Six Sigma users, service companies such as financial institutions, retailers, and health-care organizations are beginning to apply it. What impact can Six Sigma have? Let’s look at an example.
It used to take Wellmark Blue Cross and Blue Shield, a managed-care health-care company, 65 days or more to add a new doctor to its medical plans. Thanks to Six Sigma, the company discovered that half the processes they used were redundant. With those unnecessary steps gone, the job now gets done in 30 days or less and with reduced staff. The company also has been able to reduce its administrative expenses by $3 million per year, an amount passed on to consumers through lower health premiums.52
Although it’s important for managers to recognize that many positive benefits come from obtaining ISO 9000 certification or Six Sigma, the key benefit comes from the quality improvement journey itself. In other words, the goal of quality certification should be having work processes and an operations system in place that enable organizations to meet customers’ needs and employees to perform their jobs in a consistently high-quality way.
3 How Are Projects Managed?
As we discussed in Chapter 8, many organizations are structured around projects. A project is a one-time-only set of activities with a definite beginning and ending point.53 Projects vary in size and scope, from a NASA space shuttle launch to a wedding. Project management is the task of getting the activities done on time, within budget, and according to specifications.
Project management has actually been around for a long time in industries such as construction and movie making, but now it has expanded into almost every type of business. What explains the growing popularity of project management? It fits well with a dynamic environment and the need for flexibility and rapid response. Organizations are increasingly undertaking projects that are somewhat unusual or unique, have specific deadlines, contain complex interrelated tasks requiring specialized skills, and are temporary in nature. These types of projects don’t lend themselves well to the standardized operating procedures that guide routine and continuous organizational activities.54
In the typical project, team members are temporarily assigned to and report to a project manager who coordinates the project’s activities with other departments and reports directly to a senior executive. The project is temporary: It exists only long enough to complete its specific objectives. Then it’s wound down and closed up; members move on to other projects, return to their permanent departments, or leave the organization.
If you were to observe a group of supervisors or department managers for a few days, you would see them regularly detailing what activities have to be done, the order in which they are to be done, who is to do each, and when they are to be completed. The managers are doing what we call scheduling. The following discussion reviews some useful scheduling devices.
How Do You Use A Gantt Chart?
The Gantt chart is a planning tool developed around the turn of the century by Henry Gantt. The idea behind the Gantt chart is relatively simple. It’s essentially a bar graph, with time on the horizontal axis and the activities to be scheduled on the vertical axis. The bars show output, both planned and actual, over a period of time. The Gantt chart visually shows when tasks are supposed to be done and compares the assigned date with the actual progress on each. This simple but important device allows managers to detail easily what has yet to be done to complete a job or project and to assess whether it’s ahead of, behind, or on schedule.
Exhibit MOM–5 shows a Gantt chart that was developed for book production by a manager in a publishing firm. Time is expressed in months across the top of the chart. Major activities are listed down the left side. The planning comes in deciding what activities need to be done to get the book finished, the order in which those activities need to be done, and the time that should be allocated to each activity. The blue shading represents actual progress made in completing each activity.
Exhibit MOM–5
A Sample Gantt Chart

A Gantt chart, then, actually becomes a managerial control device as the manager looks for deviations from the plan. In this case, most activities were completed on time. However, if you look at the “review first pages” activity, you will notice that it’s actually almost two and a half weeks behind schedule. Given this information, the manager might want to take some corrective action to make up the lost time and to ensure that no further delays will occur. At this point, the manager can expect that the book will be published at least two weeks late if no corrective action is taken.
A modified version of the Gantt chart is a load chart. Instead of listing activities on the vertical axis, load charts list either whole departments or specific resources. This information allows managers to plan and control for capacity utilization. In other words, load charts schedule capacity by workstations. For example, Exhibit MOM–6 shows a load chart for six production editors at the same publishing firm. Each editor supervises the design and production of several books. By reviewing the load chart, the executive editor who supervises the six production editors can see who is free to take on a new book. If everyone is fully scheduled, the executive editor might decide not to accept any new projects, to accept some new projects and delay others, to ask the editors to work overtime, or to employ more production editors.
Exhibit MOM–6
A Sample Load Chart

What is a Pert Network Analysis?
Gantt and load charts are helpful as long as the activities or projects being scheduled are few and independent of each other. But what if a manager had to plan a large project—such as a complex reorganization, the launching of a major cost-reduction campaign, or the development of a new product—that required coordinating inputs from marketing, production, and product design personnel? Such projects require coordinating hundreds or thousands of activities, some of which must be done simultaneously and some of which cannot begin until earlier activities have been completed. If you are constructing a shopping mall, you obviously cannot start erecting walls until the foundation has been laid. How, then, to schedule such a complex project? Use PERT.
PERT network analysis was originally developed in the late 1950s for coordinating the more than 3,000 contractors and agencies working on the Polaris submarine weapon system. This project was incredibly complicated, with hundreds of thousands of activities that had to be coordinated. PERT is reported to have cut two years off the completion date for the Polaris project.
A PERT network is a flowchart-like diagram that depicts the sequence of activities needed to complete a project and the time or costs associated with each activity. With a PERT network, a project manager must think through what has to be done, determine which events depend on one another, and identify potential trouble spots (see Exhibit MOM–7). PERT also makes it easy to compare the effects alternative actions will have on scheduling and costs. PERT allows managers to monitor a project’s progress, identify possible bottlenecks, and shift resources as necessary to keep the project on schedule.
Exhibit MOM–7
Developing PERT Charts
Developing a PERT network requires the manager to identify all key activities needed to complete a project, rank them in order of dependence, and estimate each activity’s completion time. This procedure can be translated into five specific steps:
Identify every significant activity that must be achieved for a project to be completed. The accomplishment of each activity results in a set of events or outcomes.
Ascertain the order in which these events must be completed.
Diagram the flow of activities from start to finish, identifying each activity and its relationship to all other activities. Use circles to indicate events and arrows to represent activities. The result is a flowchart diagram that we call the PERT network.
Compute a time estimate for completing each activity, using a weighted average that employs an optimistic time estimate of how long the activity would take under ideal conditions, a most-likely estimate of the time the activity normally should take, and a pessimistic estimate that represents the time that an activity should take under the worst possible conditions. The formula for calculating the expected time is then
Finally, using a network diagram that contains time estimates for each activity, the manager can determine a schedule for the start and finish dates of each activity and for the entire project. Any delays that occur along the critical path require the most attention because they delay the entire project. That is, the critical path has no slack in it; therefore, any delay along that path immediately translates into a delay in the final deadline for the completed project.
To understand how to construct a PERT network, you need to know three terms: events, activities, and critical path. Let us define these terms, outline the steps in the PERT process, and then develop an example.
Events are end points that represent the completion of major activities. Sometimes called milestones, events indicate that something significant has happened (such as receipt of purchased items) or an important component is finished. In PERT, events represent a point in time.
Activities, on the other hand, are the actions that take place. Each activity consumes time, as determined on the basis of the time or resources required to progress from one event to another.
The critical path is the longest or most time-consuming sequence of events and activities required to complete the project in the shortest amount of time.55
Let’s apply PERT to a construction manager’s task of building a 6,500-square-foot custom home.
As a construction manager, you recognize that time really is money in your business. Delays can turn a profitable job into a money loser. Accordingly, you must determine how long it will take to complete the house. You have carefully dissected the entire project into activities and events. Exhibit MOM–8 outlines the major events in the construction project and your estimate of the expected time required to complete each activity. Exhibit MOM–9 depicts the PERT network based on the data in Exhibit MOM–8.
Exhibit MOM–8
Major Activities in Building a Custom Home
| Event | Description | Time (Weeks) | Preceding Activity |
|---|---|---|---|
| A | Approve design and get permits | 3 | None |
| B | Perform excavation/lot clearing | 1 | A |
| C | Pour footers | 1 | B |
| D | Erect foundation walls | 2 | C |
| E | Frame house | 4 | D |
| F | Install windows | 0.5 | E |
| G | Shingle roof | 0.5 | E |
| H | Install brick front and siding | 4 | F, G |
| I | Install electrical, plumbing, and heating and A/C rough-ins | 6 | E |
| J | Install insulation | 0.25 | I |
| K | Install sheetrock | 2 | J |
| L | Finish and sand sheetrock | 7 | K |
| M | Install interior trim | 2 | L |
| N | Paint house (interior and exterior) | 2 | H, M |
| O | Install all cabinets | 0.5 | N |
| P | Install flooring | 1 | N |
| Q | Final touch-up and turn over house to homeowner | 1 | O, P |
Exhibit MOM–9
A PERT Network for Building a Custom Home

How Does Pert Operate?
Your PERT network tells you that if everything goes as planned, it will take just over 32 weeks to build the house. This time is calculated by tracing the network’s critical path: A B C D E I J K L M N P Q. Any delay in completing the events along this path will delay the completion of the entire project. For example, if it took six weeks instead of four to frame the house (event E), the entire project would be delayed by two weeks (or the time beyond that expected). But a one-week delay for installing the brick (event H) would have little effect because that event is not on the critical path. By using PERT, the construction manager would know that no corrective action would be needed. Further delays in installing the brick, however, could present problems—for such delays may, in actuality, result in a new critical path. Now back to our original critical path dilemma.
Notice that the critical path passes through N, P, and Q. Our PERT chart (Exhibit MOM–9) tells us that these three activities take four weeks. Wouldn’t path N O Q be faster? Yes. The PERT network shows that it takes only 3.5 weeks to complete that path. So why isn’t N O Q on the critical path? Because activity Q cannot begin until both activities O and P are completed. Although activity O takes half a week, activity P takes one full week. So, the earliest we can begin Q is after one week. What happens to the difference between the critical activity (activity P) time and the noncritical activity (activity O) time? The difference, in this case half a week, becomes slack time. Slack time is the time difference between the critical path and all other paths. What use is there for slack? If the project manager notices some slippage on a critical activity, perhaps slack time from a noncritical activity can be borrowed and temporarily assigned to work on the critical one.
As you can see, PERT is both a planning and a control tool. Not only does PERT help us estimate the times associated with scheduling a project, but it also gives us clues about where our controls should be placed. Because any event on the critical path that is delayed will delay the overall project (making us not only late but also probably over budget), our attention needs to be focused on the critical activities at all times. For example, if activity F (installing windows) is delayed by a week because supplies have not arrived, that is not a major issue. It’s not on the critical path. But if activity P (installing flooring) is delayed from one week to two weeks, the entire project will be delayed by one week. Consequently, anything that has the immediate potential for delaying a project (critical activities) must be monitored closely.
Final Thoughts on Managing Operations
As we said earlier, it’s the manager’s job to manage the organization’s operating systems, organizational control systems, and quality programs. That’s the only way organizations will survive in today’s increasingly competitive global economy.
Endnotes
1. D. Eng, “Cheesecake Factory’s Winning Formula,” Fortune, May 2, 2011, pp. 19–20; and D. McGinn, “Faster Food,” Newsweek, April 19, 2004, pp. E20–E22.
2. All of the examples are from the World Factbook 2015, https://www.cia.gov/library/publications/the-world-factbook/geos/bl.html.
3. D. Michaels and J. L. Lunsford, “Streamlined Plane Making,” Wall Street Journal, April 1, 2005, pp. B1+.
4. T. Aeppel, “Workers Not Included,” Wall Street Journal, November 19, 2002, pp. B1+.
5. A. Aston and M. Arndt, “The Flexible Factory,” BusinessWeek, May 5, 2003, pp. 90–91.
6. P. Panchak, “Pella Drives Lean throughout the Enterprise,” IndustryWeek, June 2003, pp. 74–77.
7. J. Ordonez, “McDonald’s to Cut the Cooking Time of Its French Fries,” Wall Street Journal, May 19, 2000, p. B2.
8. C. Fredman, “The Devil in the Details,” Executive Edge, April–May 1999, pp. 36–39.
9. http://new.skoda-auto.com/Documents/AnnualReports/skoda_auto_annual_report_2007_%20EN_FINAL.pdf (July 8, 2008); and T. Mudd, “The Last Laugh,” IndustryWeek, September 18, 2000, pp. 38–44.
10. Based on “Honorary Members Form Impressive Lineup of Quality Thinkers,” Quality Progress, March 2011, p. 17; “W. Edwards Deming,” Quality Progress, November 2010, p. 17; R. Aguayo, Dr. Deming: The American Who Taught the Japanese About Quality (New York: Fireside Press, 1991); M. Walton, The Deming Management Method (New York: Penguin Group, 1986); and W. E. Deming, “Improvement of Quality and Productivity Through Action by Management,” National Productivity Review, Winter 1981–1982, pp. 12–22.
11. T. Vinas, “Little Things Mean a Lot,” IndustryWeek, November 2002, p. 55.
12. P. Panchak, “Shaping the Future of Manufacturing,” IndustryWeek, January 2005, pp. 38–44; M. Hammer, “Deep Change: How Operational Innovation Can Transform Your Company,” Harvard Business Review, April 2004, pp. 84–94; S. Levy, “The Connected Company,” Newsweek, April 28, 2003, pp. 40–48; and J. Teresko, “Plant Floor Strategy,” IndustryWeek, July 2002, pp. 26–32.
13. T. Laseter, K. Ramdas, and D. Swerdlow, “The Supply Side of Design and Development,” Strategy & Business, Summer 2003, p. 23; J. Jusko, “Not All Dollars and Cents,” IndustryWeek, April 2002, p. 58; and D. Drickhamer, “Medical Marvel,” IndustryWeek, March 2002, pp. 47–49.
14. Q. H. Soon and Z. M. Udin, “Supply Chain Management from the Perspective of Value Chain Flexibility: An Exploratory Study,” Journal of Manufacturing Technology Management, May 2011, pp. 506–26; G. Soni and R. Kodali, “A Critical Analysis of Supply Chain Management Content in Empirical Research,” Business Process Management, April 2011, pp. 238–56; and J. H. Sheridan, “Managing the Value Chain,” IndustryWeek, September 6, 1999, pp. 1–4, available online in archives at www.industryweek.com.
15. “Supply Chain Management: A New Narrative,” Strategic Direction, March 2011, pp. 18–21; and Sheridan, “Managing the Value Chain.”
16. S. Leibs, “Getting Ready: Your Suppliers,” IndustryWeek, www.industryweek.com (September 6, 1999).
17. See, for example, J. Jusko, “Procurement—Not All Dollars and Cents,” IndustryWeek, www.industryweek.com (April 4, 2002).
18. See “News Item Future Challenges for the Aromatics Supply Chain,” speech given by Nancy Sullivan, Vice President Aromatics & Phenol, to the First European Aromatics and Derivatives Conference, London, UK (May 29, 2002), available online at http://www.shellchemicals.com/newstroom/1,1098.71.00.html.
19. D. Bartholomew, “The Infrastructure,” IndustryWeek, September 6, 1999, p. 1.
20. G. Taninecz, “Forging the Chain,” IndustryWeek, May 15, 2000, pp. 40–46.
21. T. Vinas, “A Map of the World: IW Value-Chain Survey,” IndustryWeek, September 2005, pp. 27–34.
22. See J. H. Sheridan, “Now It’s a Job for the CEO,” IndustryWeek, March 20, 2000, pp. 22–30.
23. R. Norman and R. Ramirez, “From Value Chain to Value Constellation,” Harvard Business Review on Managing the Value Chain (Boston: Harvard Business School Press, 2000), pp. 185–219.
24. S. Leibs, “Getting Ready: Your Customers,” IndustryWeek, September 6, 1999, p. 4.
25. See, for example, C. Lunan, “Workers Doing More in Less Time,” Charlotte Observer, June 1, 2002, p. D1.
26. Leibs, “Getting Ready: Your Customers,” p. 3.
27. See, for instance, L. Harrington, “The Accelerated Value Chain: Supply Chain Management Just Got Smarter, Faster, and More Cost-Effective, Thanks to a Groundbreaking Alliance between Intel and Technologies,” IndustryWeek, April 2002, pp. 45–51.
28. Ibid.
29. Ibid.; and Sheridan, “Managing the Value Chain.”
30. Sheriden, “Managing the Value Chain,” p. 3.
31. Leibs, “Getting Ready: Your Customers,” p. 4.
32. Sheriden, “Managing the Value Chain,” pp. 2–3; Leibs, “Getting Ready: Your Customers,” 1, 4; and Bartholomew, “The Infrastructure,” p. 6.
33. Taninecz, “Forging the Chain.”
34. Ibid.
35. Ibid.
36. D. Drickhamer, “On Target,” IndustryWeek, October 16, 2000, 111–12.
37. Ibid.
38. “Top Security Threats and Management Issues Facing Corporate America: 2003 Survey of Fortune 1000 Companies,” ASIS International and Pinkerton, www.asisonline.org.
39. Sheridan, “Managing the Value Chain,” p. 4.
40. S. Rosenbloom, “Solution, or Mess? A Milk Jug for a Green Earth,” New York Times Online, June 30, 2008.
41. K. T. Greenfeld, “Taco Bell and the Golden Age of Drive-Thru,” Bloomberg BusinessWeek Online, May 5, 2011; and S. Anderson, “Restaurants Gear Up for Window Wars,” Springfield, Missouri, News-Leader, January 27, 2006, p. 5B.
42. D. Bartholomew, “Quality Takes a Beating,” IndustryWeek, March 2006, pp. 46–54; J. Carey and M. Arndt, “Making Pills the Smart Way,” BusinessWeek, May 3, 2004, pp. 102–03; and A. Barrett, “Schering’s Dr. Feelbetter?” BusinessWeek, June 23, 2003, pp. 55–56.
43. T. Vinas, “Six Sigma Rescue,” IndustryWeek, March 2004, p. 12.
44. J. S. McClenahen, “Prairie Home Companion,” IndustryWeek, October 2005, pp. 45–46.
45. T. Vinas, “Zeroing In on the Customer,” IndustryWeek, October 2004, pp. 61–62.
46. W. Royal, “Spotlight Shines on Maquiladora,” IndustryWeek, October 16, 2000, pp. 91–92.
47. See B. Whitford and R. Andrew (eds.), The Pursuit of Quality (Perth: Beaumont Publishing, 1994).
48. D. Drickhamer, “Road to Excellence,” IndustryWeek, October 16, 2000, pp. 117–18.
49. G. Hasek, “Merger Marries Quality Efforts,” IndustryWeek, August 21, 2000, pp. 89–92.
50. J. Jusko, “An Elite Crew,” IndustryWeek, March 2011, pp. 17–18; and M. Arndt, “Quality Isn’t Just for Widgets,” BusinessWeek, July 22, 2002, pp. 72–73.
51. E. White, “Rethinking the Quality Improvement Program,” Wall Street Journal, September 19, 2005, p. B3.
52. M. Arndt, “Quality Isn’t Just for Widgets.”
53. For a thorough overview of project management, see S. Berkun, The Art of Project Management (Upper Saddle River, NJ: Prentice Hall, 2005); or J. K. Pinto, Project Management: Achieving Competitive Advantage and MS Project (Upper Saddle River, NJ: Prentice Hall, 2007).
54. H. Maylor, “Beyond the Gantt Chart: Project Management Moving On,” European Management Journal, February 2001, pp. 92–101.
55. For additional information on CPM, see W. A. Haga and K. A. Marold, “A Simulation Approach to the PERT/CPM Time-Cost Trade-Off Problem,” Project Management Journal, June 2004, pp. 31–37.