
What’s New in Excel 2007?
If you’ve used a previous version of Excel, this section is for you. Here you’ll find a quick overview of what’s new and what’s changed in Excel 2007.
A new user interface
The first thing you notice about Excel 2007 is its new look. The time-honored menu-and-toolbar user interface has been scrapped and replaced with a new “tab-and-ribbon” interface. Although the new interface kind of resembles menus and toolbars, you’ll find that it’s radically different.
Long-time Excel users have probably noticed that, with each new version, the menu system has gotten increasingly complicated. In addition, the number of toolbars had become almost overwhelming. After all, every new feature must have a way to be accessed. In the past, access meant adding more items to the menus and building new toolbars. The Microsoft designers set out to solve the problem, and the new Ribbon interface is their solution.
Cross-Ref
Chapter 2 contains more information about the new Ribbon interface, including a description of its components.
Many experienced Excel users might suffer from a mild case of bewilderment as they realize that all their familiar command sequences no longer work. Beginning users, on the other hand, will be able to get up to speed much more quickly because they won’t be overwhelmed with irrelevant menus and toolbars.
Other elements that comprise the new look include
Six new modern-looking fonts: The default workbook font is now 11-point Calibri, which, I think, is much more readable than the old 10-point Arial, especially in smaller sizes.
Quick Access toolbar: A personal toolbar, to which you can add commands that you use regularly. This toolbar is the only part of the Excel 2007 interface that the user can customize.
The Mini Toolbar: This toolbar contains commonly used formatting icons, displayed near your mouse pointer for quick access.
Larger worksheets
Over the years, perhaps the most common complaint about Excel was the size of a worksheet. Users who required more rows or columns were simply out of luck. Microsoft finally, responded, and Excel 2007 has upped the ante significantly. A worksheet now has 1,048,576 rows and 16,384 columns, which works out to more than 17 billion cells—almost three cells for every man, woman, and child on the planet. Stated differently, an Excel 2007 worksheet has more than 1,000 times as many cells as an Excel 2003 worksheet.
Note
Having more rows and columns doesn’t mean that you can actually use them all. If you attempted to fill up all cells in a worksheet, you would soon run out of memory. The advantage to having more rows and columns is the flexibility it provides.
In addition to a larger worksheet grid, Excel 2007 has also increased some other limits that have frustrated users. Table 12-1 summarizes some of these changes.
| Excel 2003 | Excel 2007 | |
|---|---|---|
| Number of rows | 65,536 | 1,048,576 |
| Number of columns | 256 | 16,384 |
| Amount of memory used | 1GB | Maximum allowed by Windows |
| Number of colors | 56 | 4.3 billion |
| Number of conditional formats per cell | 3 | Unlimited |
| Number of levels of sorting | 3 | 64 |
| Number of levels of undo | 16 | 100 |
| Number of items shown in the Auto-Filter dropdown | 1,000 | 10,000 |
| The total number of characters that can display in a cell | 1,000 | 32,000 |
| Number of unique styles in a workbook | 4,000 | 64,000 |
| Maximum number of characters in a formula | 1,000 | 8,000 |
| Number of levels of nesting in a formula | 7 | 64 |
| Maximum number of function arguments | 30 | 255 |
New file formats
Over the years, Excel’s XLS file format has become an industry standard. Excel 2007 still supports that format, but it now uses new default “open” file formats that are based on XML (Extensible Markup Language).
Cross-Ref
Find out more about the new Office file formats in Chapter 3.
For compatibility, Excel 2007 still supports the old file formats so that you can continue to share your work with those who haven’t upgraded to Excel 2007.
Worksheet tables
Excel, of course, has always been able to deal with tables. A table is just a rectangular range of cells that (usually) contain column headers. The designers of Excel 2007 realized that such tables are widely used in Excel, and they’ve taken the concept to a new level. Working with tables is easier than ever.
Once you designate a particular range to be a table (using the Insert ![]() Tables
Tables ![]() Table command), Excel provides you with some very efficient tools that work with the table. For example:
Table command), Excel provides you with some very efficient tools that work with the table. For example:
You can apply attractive formatting with a single click.
You can easily insert summary formulas in the table’s total row.
If each cell in a column contains the same formula, you can edit one of the formulas, and the others change automatically.
You can easily toggle the display of the table’s the header row and totals row.
Removing duplicate entries is easy.
AutoFiltering and sorting options have been expanded.
If you create a chart from a table, the chart will always reflect the data in the table—even if you add new rows.
If you scroll a table downwards so that the header row is no longer visible, the column headers now display where the worksheet column letters would be.
Figure 12-1 shows a table in a worksheet.

Styles and themes
Excel has always supported named styles, which can be applied to cells and ranges. Excel 2007 brings this feature to the forefront by providing a good assortment of predefined styles, easily accessible by choosing Home ![]() Styles
Styles ![]() Cell Styles.
Cell Styles.
With the introduction of document themes, Excel 2007 makes it easy to create good-looking worksheets. A theme consists of a color palette, font set, and effects. You now have one-click access to a gallery of professionally designed themes that can dramatically change the look of your entire spreadsheet—almost always for the better. Access the theme gallery by choosing Page Layout ![]() Themes
Themes ![]() Themes. And yes. You can still create ugly Excel documents if you try hard enough.
Themes. And yes. You can still create ugly Excel documents if you try hard enough.
Better-looking charts
There is both good news and bad news relating to the charting features in Excel 2007. First the bad news: Excel 2007 offers no new chart types, and many of the long-time chart-related feature requests have been ignored by Microsoft. The good news? Excel charts now look better than ever. For the first time, you can honestly use the term “boardroom quality” to describe Excel charts
Cross-Ref
I discuss charts in Chapter 18.
Page layout view
As an option, you can display your worksheet as a series of pages. This new Page Layout view ensures there are no surprises when it’s time to print your work. Even better, the Page Layout view includes “click and type” page headers and footers—which is much more intuitive than the old method. Unlike the standard print preview, Page Layout view is fully functional in terms of spreadsheet editing.
Figure 12-2 shows a spreadsheet displayed in Page Layout view. The display is zoomed out to show multiple pages.
Figure 12-2. Excel’s new Page Layout view makes it easy to see how your printed work will appear.

Enhanced conditional formatting
Conditional formatting refers to the ability to format a cell based on its value. Conditional formatting makes it easy to highlight certain values so that they stand out visually. For example, you may set up conditional formatting so that if a formula returns a negative value, the cell background displays green.
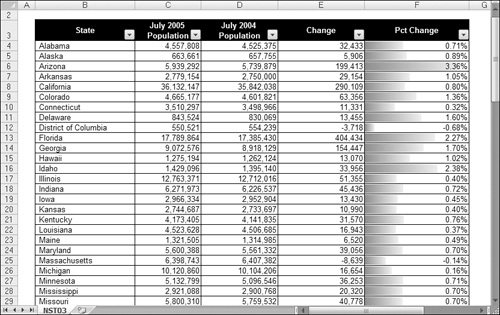
In the past, a cell could have at most three conditions applied. With Excel 2007, you can format a cell based on an unlimited number of conditions. But that’s the least of the improvements. Excel 2007 provides a number of new data visualizations: data bars, color scales, and icon sets. Figure 12-3 shows an example of a range that uses conditional formatting to display data bars directly in the cells. The size of each data bar is proportional to the value in the cell.
Figure 12-3. Data bars are just one of the new conditional formatting options.
Excel 2007 includes quite a few other improvements to conditional formatting. In general, conditional formatting is much more flexible, easier to set up, and relies less on creating custom formulas to define the formatting rules.
Consolidated options
In the past, Excel provided far too many dialog boxes to set various options. In Excel 2007, most dialog boxes have been consolidated into a massive Excel Options dialog box. To display this dialog box, choose Office Button ![]() Excel Options.
Excel Options.
The options are grouped into tabs, which you select on the left. Locating some of the options still isn’t easy, but the new implementation is much better than it used to be. The Excel Options dialog box is also resizable—just click and drag the lower-right corner to change the size.
SmartArt
Excel 2007 still includes a wide assortment of Shapes that you can use to create visual diagrams, such as flow charts, org charts, or diagrams that depict relationships. But the new SmartArt feature is a much better tool for such tasks. You can quickly add shadows, reflection, glow, and other special effects.
Figure 12-4 shows two SmartArt diagrams. The diagram on the left is the original, and the one on the right is the same diagram after a single mouse click that changed the layout and style.

Note
SmartArt works in Excel just as it does in Word. Chapter 9 covers the SmartArt in more detail. In Excel, click the Insert tab on the Ribbon and then click SmartArt to begin inserting a SmartArt graphic.
Formula AutoComplete
Entering formulas in Excel 2007 can be a bit less cumbersome, thanks to the new Formula AutoComplete feature. When you begin typing a formula, Excel displays a continually updated drop-down list of matching items (see Figure 12-5), including a description of each item. When you see the item you want, press Tab to enter it into your formula. The items in this list consist of functions, defined names, and table references.
Figure 12-5. The Formula AutoComplete feature can speed up formula entry.

Cross-Ref
Refer to Chapter 15 for more information about Formula AutoComplete.
Compatibility Checker
Given all the new features in Excel 2007, you may be hesitant to share a workbook with others who use an earlier version of Excel. To find out how your workbook will function with previous versions, use the compatibility checker. Choose Office Button ![]() Prepare
Prepare ![]() Run Compatibility Checker. Figure 12-6 shows an example.
Run Compatibility Checker. Figure 12-6 shows an example.
Figure 12-6. Use the Compatibility Checker if you plan to share your workbooks with people who use an earlier version of Excel.

Improved PivotTables
Excel’s PivotTable feature is probably one of its most underutilized features. A PivotTable can turn a large range of raw data into a useful interactive summary table with only a few mouse clicks. Microsoft hopes to make this feature more accessible by improving just about every aspect of pivot tables in Excel 2007.
One other thing worth noting: Charts created from PivotTables (PivotCharts) now retain their formatting when they’re updated. This loss of formatting had been a frustration for hundreds of thousands of users, and Microsoft finally did something about it.
New Worksheet functions
Excel 2007 has five new worksheet functions, described in Table 12-2.
| Function | Use |
|---|---|
| IFERROR | Returns a value you specify if a formula evaluates to an error; otherwise, returns the result of the formula |
| AVERAGEIF | Calculates a conditional average (similar to SUMIF and COUNTIF) |
| AVERAGEIFS | Calculates a conditional average using multiple criteria |
| SUMIFS | Calculates a conditional sum using multiple criteria |
| COUNTIFS | Calculates a conditional COUNT using multiple criteria |
In addition, 39 worksheet functions that used to require the Analysis Toolpak add-in are now built in.
Excel 2007 also includes seven new CUBE functions that retrieve data from SQL Server Analysis Services.
Cross-Ref
Chapter 15 covers formulas and functions.
Other new features
Other new features in Excel 2007 worth noting are:
Trust Center: Protecting yourself from malicious macros is a bit easier with Excel 2007. For example, you can disable all macros, except those in workbooks that are stored in trusted locations on your computer.
PDF add-in: You can create an industry-standard Adobe PDF file directly from Excel using an add-in available from Microsoft. Search Excel’s Help system for “PDF” to learn more.
Improved zooming: Use the Zoom control or Zoom slider on the right side of the status bar to quickly zoom in or zoom out on your worksheet.
More control over the status bar: You can now control the type of information that appears in the status bar.
Color Schemes: Change the appearance of Excel by applying one of three color schemes that ship with Excel (Blue, Silver, or Black).
Resizable formula bar: When editing lengthy formulas, you can increase the height of the formula bar so that it doesn’t obscure your worksheet. Just click and drag on the bottom border of the formula bar.
Lots of new templates: Why reinvent the wheel? Choose Office Button
 New, and you can choose from a variety of templates. One of them may be exactly (or at least close) to what you need.