
Understanding Reports
Reports present a customized view of your data. Report output is viewed onscreen or printed to provide a hard copy of the data. Reports provide summaries of the information contained in the database. Data can be grouped and sorted in any order and can create totals that add numbers, calculate averages or other statistics, and graphically display data. Reports can include pictures and other graphics as well as memo fields in a report. If you can think of a report you want, Access probably supports it.
Understanding report types
Four basic types of reports are used by businesses:
Tabular reports: These print data in rows and columns with groupings and totals. Variations include summary and group/total reports.
Columnar reports: These print data as a form and can include totals and graphs.
Mail-merge reports: These create form letters.
Mailing labels: These create multicolumn labels or snaked-column reports.
Graphs: Visual representation of your data in a form such as a bar or a pie chart.
Tabular reports
Figure 37-1 is a typical tabular-type report (rptProductsSummary) displayed in print preview. Tabular reports (also known as groups/totals reports) are similar to a table that displays data in neat rows and columns. Tabular reports, unlike forms or datasheets, usually group data by one or more fields. Often, tabular reports calculate and display subtotals or statistical information for numeric fields in each group. Some reports include page totals and grand totals. You can even have multiple snaked columns so that you can create directories (such as telephone books). These types of reports often use page numbers, report dates, or lines and boxes to separate information. Reports may have color and shading and display pictures, business graphs, and memo fields. A special type of summary tabular report can have all the features of a detail tabular report but omit record details.
Figure 37-1. A tabular report (rptProductsSummary) displayed in Print Preview.

Columnar reports
Columnar reports generally display one or more records per page, but do so vertically. Columnar reports display data very much as a data-entry form does but are used strictly for viewing data and not for entering data. Figure 37-2 shows part of a columnar report (rptProducts) in Print Preview.
Figure 37-2. A columnar report showing report controls distributed throughout the entire page.

Another type of columnar report displays one main record per page (like a business form) but can show many records within embedded subforms. An invoice is a typical example. This type of report can have sections that display only one record and at the same time have sections that display multiple records from the many side of a one-to-many relationship—and even include totals.
Figure 37-3 shows an invoice report (rptInvoice) from the Access Auto Auctions database system in Report view.
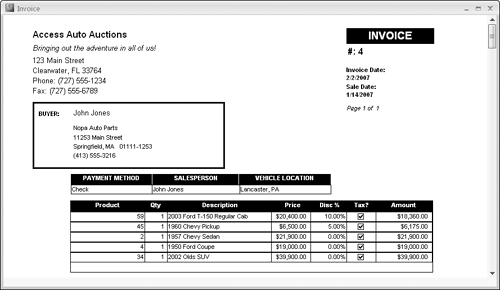
In Figure 37-3, the information in the top portion of the report is on the “main” part of the report, whereas the product details near the bottom of the figure are contained in a subreport embedded within the main report.
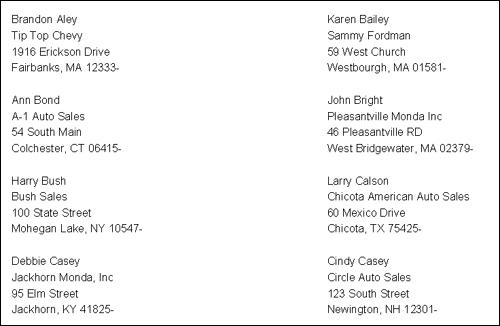
Mailing labels
Mailing labels are also a type of report. You can easily create mailing labels, shown in Figure 37-4, using the Label Wizard to create a report in Access. The Label Wizard enables you to select from a long list of Avery label (and other vendors) paper styles, after which Access correctly creates a report design based on the data you specify to create your label. After the label is created, you can open the report in Design mode and customize it as needed.
Distinguishing between reports and forms
The main difference between reports and forms is the purpose of the output. Whereas forms are primarily for data entry and interaction with the users, reports are for viewing data (either onscreen or in hard copy form). Calculated fields can be used with forms to display an amount based on other fields in the record. With reports, you typically perform calculations on a group of records, a page of records, or all the records processed during the report. Anything you can do with a form—except input data—can be duplicated by a report. In fact, you can save a form as a report and then customize the form controls in the Report Design window.
Understanding the process of creating a report
Planning a report begins long before you actually create the report design. The report process begins with your desire to view your data in a table, but in a way that differs from datasheet display. You begin with a design for this view; Access begins with raw data. The purpose of the report is to transform the raw data into a meaningful set of information. The process of creating a report involves several steps:
- Defining the report layout
- Assembling the data
- Creating the report design using the Access Report Design window
- Printing or viewing the report
Defining the report layout
You should begin by having a general idea of the layout of your report. You can define the layout in your mind, on paper, or interactively using the Access Report Designer. Good reports can first be laid out on paper, showing the controls needed and the placement of the controls. Very often, an Access report is expected to duplicate an existing paper report used by the application’s consumers.
Assembling the data
After you have a general idea of the report layout, you should assemble the data needed for the report. Access reports use data from two primary sources: a single database table, or a recordset produced by the query. You can join many tables in a query and use the query’s recordset as the record source for your report. A query’s recordset appears to an Access report as if it were a single table.
As you learned earlier in the last chapter, you specify the fields, records, and sort order of the records in a query. Access treats this recordset data as a single table (for processing purposes) in datasheets, forms, and reports. The recordset becomes the source of data for the report and Access processes each record to create the report. When the report is run, Access matches data from the recordset or table against the fields specified in the report and uses the data available at that moment to produce the report.
In this example, you use data from tblProducts to create a relatively simple tabular report.