
Creating a Report with Report Wizards
Access enables you to create virtually any type of report. Some reports, however, are easier to create than others, especially when a Report Wizard is used as a starting point. Like Form Wizards, Report Wizards give you a basic layout for your report, which you can then customize.
Report Wizards simplify the layout process of your controls by visually stepping you through a series of questions about the type of report that you want to create and then automatically creating the report for you. In this chapter, you use Report Wizards to create tabular and columnar reports. Feel free to use the database file you downloaded for this chapter to follow along with the actions described.
Creating a new report
The Access Ribbon contains several commands for creating new reports for your applications. The Create tab of the Ribbon includes a grouping called Reports containing several options such as Report, Labels, and Report Wizard. For this exercise, use the Report Wizard button to create a new report from tblProducts. Begin by clicking the Report Wizard button in the Reports group of the Create Ribbon tab. The Report Wizard dialog opens, as shown in Figure 37-5.
Figure 37-5. The first screen of the Report Wizard after selecting a data source and fields.
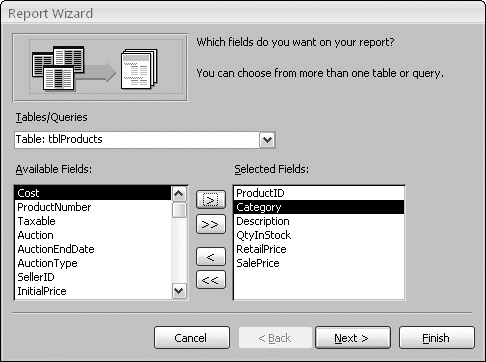
In Figure 37-5, tblProducts has been selected as the data source for the new report. Under the data source selection drop-down list is a list of available fields. Clicking on a field in this list and pressing the right pointing arrow moves the field from the Available Fields list to the Selected Fields list, adding it to the report. For this exercise, select Product ID, Description, QtyInStock, RetailPrice, and SalePrice.
Tip
Double-click any field in the Available Fields list to add it to the Selected Fields list. You can also double-click any field in the Selected Fields list to remove it from the box. Access then moves the field back to the Available Fields list.
You are limited to selecting fields from the original record source you started with. You can select fields from other tables or queries by using the Tables/Queries drop-down list in the Report Wizard. As long as you have specified valid relationships so that Access properly links the data, these fields are added to your original selection and you use them on the report. If you choose fields from unrelated tables, a dialog box asks you to edit the relationship and join the tables. Or, you can return to the Report Wizard and remove the fields.
After you have selected your data, click the Next button to go to the next wizard dialog box.
Selecting the grouping levels
The next dialog box enables you to choose which field(s) to use for grouping data. Figure 37-6 shows the Category field selected as the data grouping field for the report. The field selected for grouping determines how data appears on the report, and the grouping fields appear as group headers and footers in the report. Groups are most often used to combine data that are logically related. For instance, you may choose to group on CustomerID so that each customer’s sales history appears as a group on the report. You use the report’s group headers and footers to display the customer name and any other information specific to each customer.
Figure 37-6. Specifying the report’s grouping.

The Report Wizard lets you specify as many as four group fields for your report. You use the Priority buttons to change the grouping order on the report. The order you select for the group fields is the order of the grouping hierarchy.
Select the Category field as the grouping field and click (>) to specify a grouping based on category values. Notice that the picture changes to show Category as a grouping field, as shown in Figure 37-6. Each of the other fields (ProductID, Description, QtyInStock, RetailPrice, and SalesPrice) selected for the report will appear within the Category groups.
Defining the group data
After you select the group field(s), click the Grouping Options button at the bottom of the dialog box to display another dialog box, which enables you to further define how your report uses the group field.
For instance, you can choose to group by only the first character of a field chosen for grouping. This means that all records with the same first character in the grouping field are included as a single group. If you group a customers table by the CustomerName, and specify to group on the first character of the CustomerName field, a group header and footer appears for the set of all customers whose name begins with the same character. There would be a group for all records with a CustomerName beginning with the letter A, another group for all records with CustomerName beginning with the letter B, and so on.
The Grouping Options dialog box, which is displayed when you click the Grouping Options button in the lower-left corner of the Report Wizard screen, enables you to further define the grouping. This selection can vary in importance, depending on the data type.
The Grouping intervals list box displays different values for the various data types:
Text: Normal, 1st Letter, 2 Initial Letters, 3 Initial Letters, 4 Initial Letters, 5 Initial letters
Numeric: Normal, 10s, 50s, 100s, 500s, 1000s, 5000s, 10000s, 50000s, 100000s
Date: Normal, Year, Quarter, Month, Week, Day, Hour, Minute
Normal means that the grouping is on the entire field. In this example, use the entire Customer Name field.
In this example, the default text-field grouping option of Normal is acceptable.
If you displayed the Grouping Options dialog box, click the OK button to return to the Grouping levels dialog box.
Click the Next button to move to the Sort order dialog box.
Selecting the sort order
By default, Access automatically sorts the grouped records in an order that helps the grouping make sense. For instance, after you have chosen the Customer Name field to group customer records, Access arranges the groups in alphabetical order by the CustomerName. However, for your purposes, it may be useful to specify a sort within each group. As an example, your users may want to see the customer records sorted by Order Date in descending order so that the newest orders appear near the top of each customer group.
In our example, Access sorts data by the Category field. As Figure 37-7 shows, the data is also sorted by Description within each group.
Figure 37-7. Selecting the field sorting order.

The sort fields are selected by the same method you use for grouping fields in the report. You can select fields that you have not already chosen to group and use these as sorting fields. The fields chosen in this dialog box do not affect grouping. Instead, they affect only the sorting order in the Detail section fields. You select ascending or descending sort by clicking the button to the right of each sort field.
Selecting summary options
At the bottom of the sorting dialog box is a Summary Options button. Clicking this button displays the dialog box shown in Figure 37-8. This dialog box provides additional display options for numeric fields. As you can see in Figure 37-8, all of the numeric and currency fields are displayed and specified to be summed. Additionally, you can display averages, minimums, and maximums.
Figure 37-8. Selecting the summary options.

You can also decide whether to show or hide the data in the Detail section. If you select Detail and Summary, the report shows the detail data, whereas selecting Summary Only hides the Detail section and shows only totals in the report.
Finally, checking the Calculate percent of total for sums box adds the percentage of the entire report that the total represents below the total in the group footer. If, for example, you have three products and their totals are 15, 25, and 10, respectively, 30%, 50%, and 20% show below their total (that is, 50)—indicating the percentage of the total sum (100%) represented by their sum.
Clicking the OK button in this dialog box returns you to the Sorting dialog box. There you can click the Next button to move to the next wizard dialog box.
Selecting the layout
Two more dialog boxes affect the look of your report. The first (shown in Figure 37-9) enables you to determine the basic layout of the data. The Layout area provides six layout choices that tell Access whether to repeat the column headers, indent each grouping, and add lines or boxes between the detail lines. As you select each option, the picture on the left changes to show how the choice affects the report’s appearance.
Figure 37-9. Selecting the page layout.
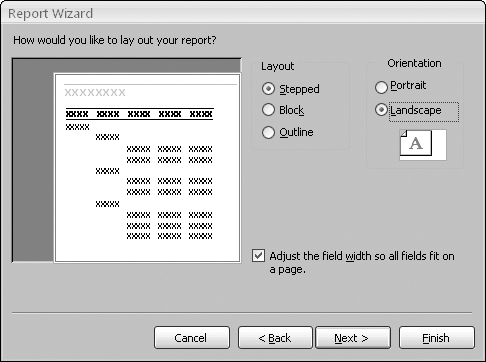
You choose between Portrait (up-and-down) and Landscape (across-the-page) layout for the report in the Orientation area. Finally, the Adjust the field width so all fields fit on a page checkbox enables you to cram a lot of data into a little area. (A magnifying glass may be necessary!)
For this example, choose Stepped and Landscape, as shown in Figure 37-9. Then click the Next button to move to the next dialog box.
Choosing the style
After you choose the layout, select the style of your report from the dialog shown in Figure 37-10. Each style has different background shadings, font size, typeface, and other formatting. As each is selected, the picture on the left changes to show a preview. For this example, choose Opulent. Finally, click the Next button to move to the last dialog box.
Figure 37-10. Choosing the style of your report.

Tip
You can customize the styles, or add your own with the AutoFormat option on the Arrange tab of the Ribbon while in Design view of the Report.
Opening the report design
The final Report Wizard dialog box contains a checkered flag, which lets you know that you’re at the finish line. The first part of the dialog box enables you to enter a title for the report. This title appears only once, at the very beginning of the report, not at the top of each page. The report title also serves as the new report’s name. The default title is the name of the table or query you initially specified as the report’s data source. The report just created in Chapter 37.accdb is named rptProducts_Wizard.
Next, choose one of the option buttons at the bottom of the dialog box:
Preview the report
Modify the report’s design
For this example, leave the default selection intact to preview the report. Clicking the Finish button displays the report in Report view. Click Finish to complete the Report Wizard and view the report (see Figure 37-11).

Report view provides an overall view of the report, but it does not show the margins, page numbering, and how the report will look when printed on a piece of paper. To get a good idea of how a report will look when printed, click the Office Button. Click the right arrow beside the Print choice, and then click Print Preview.
Using the Print Preview window
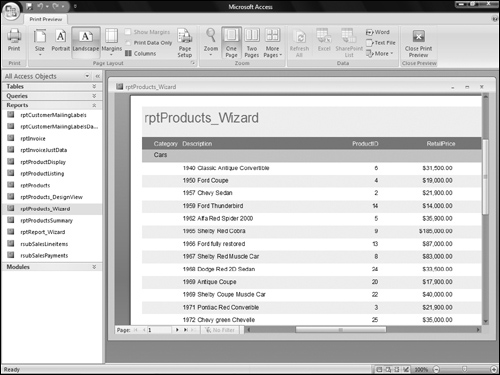
Figure 37-12 shows the Print Preview window in a zoomed view of rptProducts_Wizard. This view displays your report with the actual fonts, shading, lines, boxes, and data that will be on the printed report. Clicking the left mouse button changes the view to a page preview that shows the entire page.
Note
In the default tabbed view, each report will appear in a tab rather than a window. Figures were shown with the windowed method for screen shot purposes. To change this behavior, click Office Button ![]() Access Options. Click Current Database at the left, and work with the Document Window Options settings.
Access Options. Click Current Database at the left, and work with the Document Window Options settings.
The Print Preview tab of Ribbon in the Print Preview view transforms to display controls relevant to viewing and printing the report. The Print Preview tab of the Access Ribbon includes controls for adjusting the size, page orientation (Portrait or Landscape), and other viewing options. The Print Preview tab also includes a handy Print button for printing the report.
You can move around the page by using the horizontal and vertical scrollbars. Use the Page controls (at the bottom-left corner of the window) to move from page to page. These controls include VCR-like navigation buttons to move from page to page or to the first or last page of the report. You can also go to a specific page of the report by entering a value in the text box between the previous and next controls.
Right-clicking on the report and selecting the Multiple Pages option lets you view more than one page of the report in a single view. Figure 37-13 shows a view of the report in the Print Preview’s multipage mode. Use the navigation buttons (in the lower-left section of the Print Preview window) to move between pages, just as you would to move between records in a datasheet. The Print Preview window has a toolbar with commonly used printing commands.
Figure 37-13. Displaying multiple pages of a report in Print Preview’s page preview mode.

If, after examining the preview, you are satisfied with the report, click the Printer button on the toolbar to print the report. If you are dissatisfied, select the Close button to switch to the Report Design window and make further changes.
Viewing the Report Design window
Right-clicking the report’s title bar and selecting Design View opens the Access Report Designer on the report. As shown in Figure 37-14, the report design reflects the choices you made using the Report Wizard. You can use this view to make manual changes to your report.

Return to the Print Preview mode by selecting the Print Preview button on the Report Design toolbar or by selecting the Print Preview option from the File menu. You can also select Print or Page Setup from the File menu. This menu also provides options for saving your report.